Frontier Communications 2005 Annual Report Download - page 35
Download and view the complete annual report
Please find page 35 of the 2005 Frontier Communications annual report below. You can navigate through the pages in the report by either clicking on the pages listed below, or by using the keyword search tool below to find specific information within the annual report.-
 1
1 -
2
-
3
-
4
-
5
-
6
-
7
-
8
-
9
-
10
-
11
-
12
-
13
-
14
-
15
-
16
-
17
-
18
-
19
-
20
-
21
-
22
-
23
-
24
-
 25
25 -
 26
26 -
 27
27 -
 28
28 -
 29
29 -
 30
30 -
 31
31 -
 32
32 -
 33
33 -
 34
34 -
 35
35 -
 36
36 -
 37
37 -
 38
38 -
 39
39 -
 40
40 -
 41
41 -
 42
42 -
 43
43 -
 44
44 -
 45
45 -
46
-
47
-
48
-
49
-
50
-
51
-
52
-
53
-
54
-
55
-
56
-
57
-
58
-
59
-
60
-
61
-
62
-
63
-
64
-
65
-
66
-
67
-
68
-
69
-
70
-
71
-
72
-
73
-
74
-
75
-
76
-
77
-
78
-
79
-
80
-
81
-
82
-
83
-
84
-
85
-
86
-
87
-
88
-
89
-
90
-
91
-
92
-
93
-
94
-
95
-
96
 |
 |

33
CITIZENS COMMUNICATIONS COMPANY AND SUBSIDIARIES
On April 1, 2003, we sold approximately 11,000 telephone access lines in North Dakota. The revenues related
to these access lines totaled $1.9 million for the year ended December 31, 2003.
Change in the number of our access lines is important to our revenue and profitability. We have lost access
lines primarily because of competition, changing consumer behavior, economic conditions, changing technology,
and by some customers disconnecting second lines when they add high-speed internet or cable modem service. We
lost approximately 102,000 access lines during 2005 but added approximately 99,000 high-speed internet subscribers
during this same period. The loss of lines during 2005 was primarily among residential customers. The non-
residential line losses were principally in Rochester, New York, while the residential losses were throughout our
markets. We expect to continue to lose access lines but to increase high-speed internet subscribers during 2006. A
continued loss of access lines, combined with increased competition and the other factors discussed in MD&A, may
cause our revenues, profitability and cash flows to decrease in 2006.
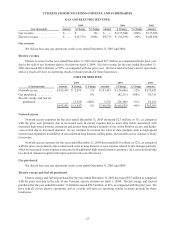
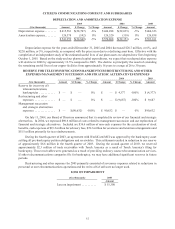
Telecommunications Revenue
2005 2004 2003
($ in thousands) Amount $ Change % Change Amount $ Change % Change Amount
Access services . . . . . . . . . . . $ 623,918 $ (10,278) -2 % $ 634,196 $(32,846) -5 % $ 667,042
Local services . . . . . . . . . . . . 829,801 (21,376) -3 % 851,177 (7,825) -1 % 859,002
Long distance services . . . . . 169,496 (14,127) -8 % 183,623 (15,759) -8 % 199,382
Data and internet services . . 175,026 36,795 27 % 138,231 30,779 29 % 107,452
Directory services . . . . . . . . . 113,092 2,469 2 % 110,623 3,689 3 % 106,934
Other . . . . . . . . . . . . . . . . . . . 91,985 7,178 8 % 84,807 4,448 6 % 80,359
ILEC revenue . . . . . . . . . 2,003,318 661 0 % 2,002,657 (17,514) -1 % 2,020,171
ELI . . . . . . . . . . . . . . . . . . . . 159,161 3,131 2 % 156,030 (9,359) -6 % 165,389
$2,162,479 $ 3,792 0 % $2,158,687 $(26,873) -1 % $2,185,560
Access Services
Access services revenue for the year ended December 31, 2005 decreased $10.3 million or 2%, as compared
with the prior year. Switched access revenue decreased $9.5 million, as compared with the prior year period, primarily
due to a decline in minutes of use. Access service revenue includes subsidy payments we receive from federal and
state agencies. Subsidy revenue decreased $15.9 million primarily due to decreased Universal Service Fund (USF)
support of $19.2 million because of increases in the national average cost per loop (NACPL) and a decrease of $2.0
million related to changes in measured factors, partially offset by an increase of $6.4 million in USF surcharge rates.
Special access revenue increased $15.1 million primarily due to growth in high-capacity circuits.
Access services revenue for the year ended December 31, 2004 decreased $32.8 million or 5%, as compared
with the prior year. Switched access revenue decreased $19.6 million primarily due to $8.3 million attributable to a
decline in minutes of use, the $7.4 million effect of federally mandated access rate reductions and $2.7 million
associated with state intrastate access rate reductions. Subsidies revenue decreased $12.8 million primarily due to
an $8.3 million decline in federal USF support because of increases in the NACPL, including a $3.5 million accrual
recorded during the third quarter of 2004 for mistakes made during 2002 and 2003 by the agency that calculates
subsidy payments and true-ups related to 2002. The decreases were partially offset by an increase in USF surcharge
revenue of $2.1 million resulting from a rate increase.
Increases in the number of competitive communications companies (including wireless companies) receiving
federal subsidies may lead to further increases in the NACPL, thereby resulting in further decreases in our subsidy
revenue in the future. The FCC and state regulators are currently considering a number of proposals for changing
the manner in which eligibility for federal subsidies is determined as well as the amounts of such subsidies. The FCC
is also reviewing the mechanism by which subsidies are funded. We cannot predict when or how these matters will
be decided nor the effect on our subsidy revenues. Future reductions in our subsidy and access revenues are not
expected to be accompanied by proportional decreases in our costs, so any further reductions in those revenues will
directly affect our profitability and cash flow.