Frontier Communications 2005 Annual Report Download - page 74
Download and view the complete annual report
Please find page 74 of the 2005 Frontier Communications annual report below. You can navigate through the pages in the report by either clicking on the pages listed below, or by using the keyword search tool below to find specific information within the annual report.-
 1
1 -
2
-
3
-
4
-
5
-
6
-
7
-
8
-
9
-
10
-
11
-
12
-
13
-
14
-
15
-
16
-
17
-
18
-
19
-
20
-
21
-
22
-
23
-
24
-
25
-
26
-
27
-
28
-
29
-
30
-
31
-
32
-
33
-
34
-
35
-
36
-
37
-
38
-
39
-
40
-
41
-
42
-
43
-
44
-
45
-
46
-
47
-
48
-
49
-
50
-
51
-
52
-
53
-
54
-
55
-
56
-
57
-
58
-
59
-
60
-
61
-
62
-
63
-
 64
64 -
 65
65 -
 66
66 -
 67
67 -
 68
68 -
 69
69 -
 70
70 -
 71
71 -
 72
72 -
 73
73 -
 74
74 -
 75
75 -
 76
76 -
 77
77 -
 78
78 -
 79
79 -
 80
80 -
 81
81 -
 82
82 -
 83
83 -
 84
84 -
85
-
86
-
87
-
88
-
89
-
90
-
91
-
92
-
93
-
94
-
95
-
96
 |
 |

F-25
CITIZENS COMMUNICATIONS COMPANY AND SUBSIDIARIES
Notes to Consolidated Financial Statements
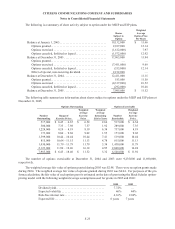
The following is a summary of share activity subject to option under the MEIP and EIP plans.
Shares
Subject to
Option
Weighted
Average
Option Price
Per Share
Balance at January 1, 2003 . . . . . . . . . . . . . . . . . . . . . . . . . . . . . . . . 19,132,000 $ 11.66
Options granted . . . . . . . . . . . . . . . . . . . . . . . . . . . . . . . . . . . . . . 2,017,000 12.14
Options exercised . . . . . . . . . . . . . . . . . . . . . . . . . . . . . . . . . . . . (1,612,000) 7.97
Options canceled, forfeited or lapsed . . . . . . . . . . . . . . . . . . . . . (1,572,000) 12.92
Balance at December 31, 2003 . . . . . . . . . . . . . . . . . . . . . . . . . . . . . 17,965,000 11.94
Options granted . . . . . . . . . . . . . . . . . . . . . . . . . . . . . . . . . . . . . . — —
Options exercised . . . . . . . . . . . . . . . . . . . . . . . . . . . . . . . . . . . . (7,411,000) 9.69
Options canceled, forfeited or lapsed . . . . . . . . . . . . . . . . . . . . . (355,000) 12.14
Effect of special, non-recurring dividend . . . . . . . . . . . . . . . . . . 2,212,000 —
Balance at December 31, 2004 . . . . . . . . . . . . . . . . . . . . . . . . . . . . . 12,411,000 11.15
Options granted . . . . . . . . . . . . . . . . . . . . . . . . . . . . . . . . . . . . . . 183,000 11.58
Options exercised . . . . . . . . . . . . . . . . . . . . . . . . . . . . . . . . . . . . (4,317,000) 10.52
Options canceled, forfeited or lapsed . . . . . . . . . . . . . . . . . . . . . (292,000) 10.48
Balance at December 31, 2005 . . . . . . . . . . . . . . . . . . . . . . . . . . . . . 7,985,000 $ 11.52
The following table summarizes information about shares subject to options under the MEIP and EIP plans at
December 31, 2005.
Options Outstanding Options Exercisable
Number
Outstanding
Range of
Exercise Prices
Weighted
Average
Exercise
Price
Weighted
Average
Remaining
Life in Years
Number
Exercisable
Weighted
Average
Exercise
Price
517,000 $ 6.45 – 6.67 $ 6.54 2.64 517,000 $ 6.54
300,000 7.33 – 7.98 7.37 1.92 289,000 7.35
1,228,000 8.19 – 8.19 8.19 6.38 737,000 8.19
173,000 8.80 – 9.68 9.02 1.55 173,000 9.02
1,399,000 10.44 – 10.44 10.44 7.41 519,000 10.44
815,000 10.64 – 11.15 11.13 4.78 815,000 11.13
1,430,000 11.79 – 11.79 11.79 5.38 1,430,000 11.79
2,123,000 11.90 – 18.46 16.14 4.95 2,068,000 16.24
7,985,000 $ 6.45 – 18.46 $ 11.52 5.32 6,548,000 $ 11.92
The number of options exercisable at December 31, 2004 and 2003 were 9,235,000 and 11,690,000,
respectively.
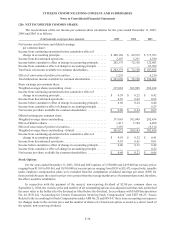
The weighted average fair value of options granted during 2005 was $2.98. There were no option grants made
during 2004. The weighted average fair value of options granted during 2003 was $6.04. For purposes of the pro
forma calculation, the fair value of each option grant is estimated on the date of grant using the Black Scholes option-
pricing model with the following weighted average assumptions used for grants in 2005 and 2003:
2005 2003
Dividend yield . . . . . . . . . . . . . . . . . . . . . . . . . . . . . . . . . 7.72% —
Expected volatility . . . . . . . . . . . . . . . . . . . . . . . . . . . . . 46% 44%
Risk-free interest rate . . . . . . . . . . . . . . . . . . . . . . . . . . . 4.16% 2.94%
Expected life . . . . . . . . . . . . . . . . . . . . . . . . . . . . . . . . . . 6 years 7 years