Frontier Communications 2005 Annual Report Download - page 57
Download and view the complete annual report
Please find page 57 of the 2005 Frontier Communications annual report below. You can navigate through the pages in the report by either clicking on the pages listed below, or by using the keyword search tool below to find specific information within the annual report.-
 1
1 -
2
-
3
-
4
-
5
-
6
-
7
-
8
-
9
-
10
-
11
-
12
-
13
-
14
-
15
-
16
-
17
-
18
-
19
-
20
-
21
-
22
-
23
-
24
-
25
-
26
-
27
-
28
-
29
-
30
-
31
-
32
-
33
-
34
-
35
-
36
-
37
-
38
-
39
-
40
-
41
-
42
-
43
-
44
-
45
-
46
-
 47
47 -
 48
48 -
 49
49 -
 50
50 -
 51
51 -
 52
52 -
 53
53 -
 54
54 -
 55
55 -
 56
56 -
 57
57 -
 58
58 -
 59
59 -
 60
60 -
 61
61 -
 62
62 -
 63
63 -
 64
64 -
 65
65 -
 66
66 -
 67
67 -
68
-
69
-
70
-
71
-
72
-
73
-
74
-
75
-
76
-
77
-
78
-
79
-
80
-
81
-
82
-
83
-
84
-
85
-
86
-
87
-
88
-
89
-
90
-
91
-
92
-
93
-
94
-
95
-
96
 |
 |

F-8
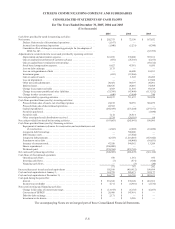
CITIZENS COMMUNICATIONS COMPANY AND SUBSIDIARIES
CONSOLIDATED STATEMENTS OF CASH FLOWS
For The Years Ended December 31, 2005, 2004 and 2003
($ in thousands)
2005 2004 2003
Cash flows provided by (used in) operating activities:
Net income . . . . . . . . . . . . . . . . . . . . . . . . . . . . . . . . . . . . . . . . . . . . . . . . . . . . . . . $ 202,375 $ 72,150 $ 187,852
Deduct: Gain on sale of discontinued operations . . . . . . . . . . . . . . . . . . . . . (1,167 ) — —
Income from discontinued operations . . . . . . . . . . . . . . . . . . . . . . . . . . . . . . (1,040 ) (5,231 ) (4,380 )
Cumulative effect of change in accounting principle for the adoption of
SFAS No. 143 . . . . . . . . . . . . . . . . . . . . . . . . . . . . . . . . . . . . . . . . . . . . . . — — (65,769 )
Adjustments to reconcile income to net cash provided by operating activities:
Depreciation and amortization expense . . . . . . . . . . . . . . . . . . . . . . . . . . . . . 541,959 570,808 593,161
Gain on expiration/settlement of customer advance . . . . . . . . . . . . . . . . . . . (681 ) (25,345 ) (6,165 )
Gain on capital lease termination/restructuring . . . . . . . . . . . . . . . . . . . . . . — — (69,512 )
Stock based compensation expense . . . . . . . . . . . . . . . . . . . . . . . . . . . . . . . . 8,427 47,581 8,956
Loss on debt exchange . . . . . . . . . . . . . . . . . . . . . . . . . . . . . . . . . . . . . . . . . . 3,175 — —
Loss on extinguishment of debt . . . . . . . . . . . . . . . . . . . . . . . . . . . . . . . . . . . — 66,480 10,851
Investment gains . . . . . . . . . . . . . . . . . . . . . . . . . . . . . . . . . . . . . . . . . . . . . . . (492 ) (12,066 ) —
Gain on sales of assets . . . . . . . . . . . . . . . . . . . . . . . . . . . . . . . . . . . . . . . . . . — 1,945 20,492
Loss on impairment. . . . . . . . . . . . . . . . . . . . . . . . . . . . . . . . . . . . . . . . . . . . . — — 15,300
Other non-cash adjustments . . . . . . . . . . . . . . . . . . . . . . . . . . . . . . . . . . . . . . 20,481 30,397 20,091
Deferred taxes . . . . . . . . . . . . . . . . . . . . . . . . . . . . . . . . . . . . . . . . . . . . . . . . . 100,636 24,016 74,508
Change in accounts receivable . . . . . . . . . . . . . . . . . . . . . . . . . . . . . . . . . . . . 4,583 11,895 69,619
Change in accounts payable and other liabilities . . . . . . . . . . . . . . . . . . . . . . (33,399 ) (67,499 ) (113,532 )
Change in other current assets . . . . . . . . . . . . . . . . . . . . . . . . . . . . . . . . . . . . (640 ) (3,694 ) 748
Net cash provided by operating activities . . . . . . . . . . . . . . . . . . . . . . . . . . . . . . . 844,217 711,437 742,220
Cash flows provided from (used by) investing activities:
Proceeds from sales of assets, net of selling expenses . . . . . . . . . . . . . . . . . 24,195 30,959 388,079
Proceeds from sale of discontinued operations . . . . . . . . . . . . . . . . . . . . . . . 43,565 — —
Capital expenditures . . . . . . . . . . . . . . . . . . . . . . . . . . . . . . . . . . . . . . . . . . . . (268,459 ) (275,204 ) (277,371 )
Securities purchased . . . . . . . . . . . . . . . . . . . . . . . . . . . . . . . . . . . . . . . . . . . . — — (1,680 )
Securities sold . . . . . . . . . . . . . . . . . . . . . . . . . . . . . . . . . . . . . . . . . . . . . . . . . 1,112 26,514 —
Other asset (purchased) distributions received . . . . . . . . . . . . . . . . . . . . . . . 5,724 (28,110 ) 68
Net cash provided from (used by) investing activities . . . . . . . . . . . . . . . . . . . . . (193,863 ) (245,841 ) 109,096
Cash flows provided from (used by) financing activities:
Repayment of customer advances for construction and contributions in aid
of construction . . . . . . . . . . . . . . . . . . . . . . . . . . . . . . . . . . . . . . . . . . . . . (1,662 ) (2,089 ) (10,030 )
Long-term debt borrowings . . . . . . . . . . . . . . . . . . . . . . . . . . . . . . . . . . . . . . — 700,000 —
Debt issuance costs . . . . . . . . . . . . . . . . . . . . . . . . . . . . . . . . . . . . . . . . . . . . . — (15,502 ) —
Long-term debt payments . . . . . . . . . . . . . . . . . . . . . . . . . . . . . . . . . . . . . . . . (6,433 ) (1,214,018 ) (653,442 )
Premium to retire debt . . . . . . . . . . . . . . . . . . . . . . . . . . . . . . . . . . . . . . . . . . — (66,480 ) (10,851 )
Issuance of common stock . . . . . . . . . . . . . . . . . . . . . . . . . . . . . . . . . . . . . . . 47,550 544,562 13,209
Shares repurchased . . . . . . . . . . . . . . . . . . . . . . . . . . . . . . . . . . . . . . . . . . . . . (250,000 ) — —
Dividends paid . . . . . . . . . . . . . . . . . . . . . . . . . . . . . . . . . . . . . . . . . . . . . . . . . (338,364 ) (832,768 ) —
Net cash used by financing activities . . . . . . . . . . . . . . . . . . . . . . . . . . . . . . . . . . (548,909 ) (886,295 ) (661,114 )
Cash flows of discontinued operations
Operating cash flows . . . . . . . . . . . . . . . . . . . . . . . . . . . . . . . . . . . . . . . . . . . 578 1,361 956
Investing cash flows . . . . . . . . . . . . . . . . . . . . . . . . . . . . . . . . . . . . . . . . . . . . (7 ) (571 ) (644 )
Financing cash flows. . . . . . . . . . . . . . . . . . . . . . . . . . . . . . . . . . . . . . . . . . . . — (3 ) (20 )
571 787 292
Increase (decrease) in cash and cash equivalents . . . . . . . . . . . . . . . . . . . . . . . . . 102,016 (419,912 ) 190,494
Cash and cash equivalents at January 1, . . . . . . . . . . . . . . . . . . . . . . . . . . . . . . . . 163,759 583,671 393,177
Cash and cash equivalents at December 31, . . . . . . . . . . . . . . . . . . . . . . . . . . . . . $ 265,775 $ 163,759 $ 583,671
Cash paid during the period for:
Interest . . . . . . . . . . . . . . . . . . . . . . . . . . . . . . . . . . . . . . . . . . . . . . . . . . . . . . . $ 318,638 $ 370,128 $ 418,561
Income taxes (refunds) . . . . . . . . . . . . . . . . . . . . . . . . . . . . . . . . . . . . . . . . . . $ 4,711 $ (4,901 ) $ (2,532 )
Non-cash investing and financing activities:
Change in fair value of interest rate swaps . . . . . . . . . . . . . . . . . . . . . . . . . . $ (13,193 ) $ (6,135 ) $ (6,057 )
Conversion of EPPICS . . . . . . . . . . . . . . . . . . . . . . . . . . . . . . . . . . . . . . . . . . $ 29,980 $ 147,991 $ —
Debt-for-debt exchange . . . . . . . . . . . . . . . . . . . . . . . . . . . . . . . . . . . . . . . . . . $ 2,171 $ — $ —
Investment write-downs . . . . . . . . . . . . . . . . . . . . . . . . . . . . . . . . . . . . . . . . . $ — $ 5,286 $ —
The accompanying Notes are an integral part of these Consolidated Financial Statements.