Frontier Communications 2005 Annual Report Download - page 38
Download and view the complete annual report
Please find page 38 of the 2005 Frontier Communications annual report below. You can navigate through the pages in the report by either clicking on the pages listed below, or by using the keyword search tool below to find specific information within the annual report.-
 1
1 -
2
-
3
-
4
-
5
-
6
-
7
-
8
-
9
-
10
-
11
-
12
-
13
-
14
-
15
-
16
-
17
-
18
-
19
-
20
-
21
-
22
-
23
-
24
-
25
-
26
-
27
-
 28
28 -
 29
29 -
 30
30 -
 31
31 -
 32
32 -
 33
33 -
 34
34 -
 35
35 -
 36
36 -
 37
37 -
 38
38 -
 39
39 -
 40
40 -
 41
41 -
 42
42 -
 43
43 -
 44
44 -
 45
45 -
 46
46 -
 47
47 -
 48
48 -
49
-
50
-
51
-
52
-
53
-
54
-
55
-
56
-
57
-
58
-
59
-
60
-
61
-
62
-
63
-
64
-
65
-
66
-
67
-
68
-
69
-
70
-
71
-
72
-
73
-
74
-
75
-
76
-
77
-
78
-
79
-
80
-
81
-
82
-
83
-
84
-
85
-
86
-
87
-
88
-
89
-
90
-
91
-
92
-
93
-
94
-
95
-
96
 |
 |

36
CITIZENS COMMUNICATIONS COMPANY AND SUBSIDIARIES
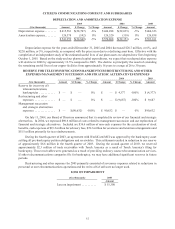
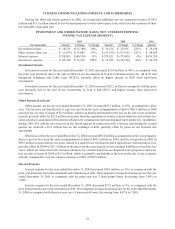
OTHER OPERATING EXPENSES
($ in thousands)
2005 2004 2003
Amount $ Change % Change Amount $ Change % Change Amount
Operating expenses . . . . . . . . . $ 607,581 $ (15,436 ) -2 % $ 623,017 $(61,952 ) -9 % $ 684,969
Taxes other than income
taxes. . . . . . . . . . . . . . . . . . . 93,115 (771 ) -1 % 93,886 (2,870 ) -3 % 96,756
Sales and marketing . . . . . . . . . 117,484 2,448 2 % 115,036 2,653 2 % 112,383
$ 818,180 $ (13,759 ) -2% $ 831,939 $(62,169 ) -7% $ 894,108
Operating Expenses
Operating expenses for the year ended December 31, 2005 decreased $15.4 million, or 2%, as compared with
the prior year primarily due to lower billing expenses as a result of the conversion of one of our billing systems in
2004 partially offset by rate increases for federal USF mandated contributions and annual fees to regulatory agencies.
We routinely review our operations, personnel and facilities to achieve greater efficiencies. These reviews may
result in reductions in personnel and an increase in severance costs. As a result of early retirement being offered to
certain of our employees during the first quarter of 2006 we expect to recognize $3.5 million to $4.0 million of
severance costs in the first quarter of 2006.
Operating expenses for the year ended December 31, 2004 decreased $62.0 million, or 9%, as compared with
the prior year primarily due to decreased operating expenses in the public services sector due to the sales of our
utilities and increased operating efficiencies and a reduction of personnel in our communications business.
Operating expenses in 2004 include $4.2 million of expenses attributable to our efforts to comply with the
internal control requirements of the Sarbanes-Oxley Act of 2002.
Included in operating expenses is stock compensation expense. Stock compensation expense was $8.4 million
and $11.0 million for the years ended December 31, 2005 and 2004, respectively. In 2006, we expect to begin
expensing the cost of the unvested portion of outstanding stock options pursuant to SFAS No. 123R. We expect to
recognize approximately $2.8 million of stock option expense related to the non-vested portion of previously granted
stock options for the year ended December 31, 2006.
Included in operating expenses is pension and other postretirement benefit expenses. In future periods, if the
value of our pension assets decline and/or projected benefit costs increase, we may have increased pension expenses.
Based on current assumptions and plan asset values, we estimate that our pension and other postretirement benefit
expenses will decrease from $19.0 million in 2005 to approximately $15.0 million to $18.0 million in 2006 and that
no contribution will be required to be made by us to the pension plan in 2006. No contribution was made to our
pension plan during 2005.
Taxes Other than Income Taxes
Taxes other than income taxes for the year ended December 31, 2004 decreased $2.9 million, or 3%, as compared
with the prior year primarily due to decreased property taxes in the public services sector of $11.6 million due to the
sales of our utilities and lower gross receipts taxes of $3.7 million in the Frontier sector that were partially offset by
higher payroll, property and franchise taxes of $13.0 million.
Sales and Marketing
Sales and marketing expenses for the year ended December 31, 2005 increased $2.4 million, or 2%, as compared
with the prior year primarily due to increased marketing and advertising in an increasingly competitive environment
and the launch of new products. As our markets become more competitive and we launch new products, we expect that
our marketing costs will increase.
Sales and marketing expenses for the year ended December 31, 2004 increased $2.7 million, or 2%, as compared
with the prior year primarily due to increased costs in the Frontier sector.