Frontier Communications 2005 Annual Report Download - page 81
Download and view the complete annual report
Please find page 81 of the 2005 Frontier Communications annual report below. You can navigate through the pages in the report by either clicking on the pages listed below, or by using the keyword search tool below to find specific information within the annual report.-
 1
1 -
2
-
3
-
4
-
5
-
6
-
7
-
8
-
9
-
10
-
11
-
12
-
13
-
14
-
15
-
16
-
17
-
18
-
19
-
20
-
21
-
22
-
23
-
24
-
25
-
26
-
27
-
28
-
29
-
30
-
31
-
32
-
33
-
34
-
35
-
36
-
37
-
38
-
39
-
40
-
41
-
42
-
43
-
44
-
45
-
46
-
47
-
48
-
49
-
50
-
51
-
52
-
53
-
54
-
55
-
56
-
57
-
58
-
59
-
60
-
61
-
62
-
63
-
64
-
65
-
66
-
67
-
68
-
69
-
70
-
 71
71 -
 72
72 -
 73
73 -
 74
74 -
 75
75 -
 76
76 -
 77
77 -
 78
78 -
 79
79 -
 80
80 -
 81
81 -
 82
82 -
 83
83 -
 84
84 -
 85
85 -
 86
86 -
 87
87 -
 88
88 -
 89
89 -
 90
90 -
 91
91 -
92
-
93
-
94
-
95
-
96
 |
 |

F-32
CITIZENS COMMUNICATIONS COMPANY AND SUBSIDIARIES
Notes to Consolidated Financial Statements
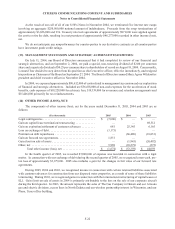
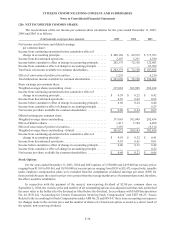
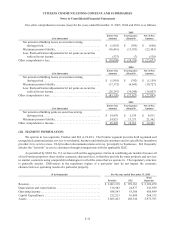
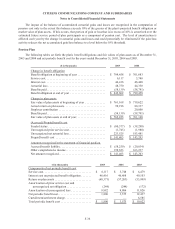
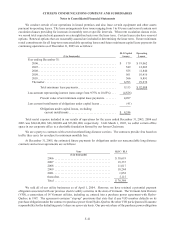
Our other comprehensive income (loss) for the years ended December 31, 2005, 2004 and 2003 is as follows:
2005
($ in thousands)
Before-Tax
Amount
Tax Expense/
(Benefit)
Net-of-Tax
Amount
Net unrealized holding losses on securities arising
during period . . . . . . . . . . . . . . . . . . . . . . . . . . . . . . . . . . . . . . . $ (1,055 ) $ (395 ) $ (660 )
Minimum pension liability . . . . . . . . . . . . . . . . . . . . . . . . . . . . . . . (36,416 ) (13,933 ) (22,483 )
Less: Reclassification adjustments for net gains on securities
realized in net income . . . . . . . . . . . . . . . . . . . . . . . . . . . . . . . . (537 ) (7 ) (530 )
Other comprehensive loss . . . . . . . . . . . . . . . . . . . . . . . . . . . . . . . . . . . $ (38,008 ) $ (14,335 ) $ (23,673 )
2004
($ in thousands)
Before-Tax
Amount
Tax Expense/
(Benefit)
Net-of-Tax
Amount
Net unrealized holding losses on securities arising
during period . . . . . . . . . . . . . . . . . . . . . . . . . . . . . . . . . . . . . . . $ (1,901 ) $ (742 ) $ (1,159)
Minimum pension liability . . . . . . . . . . . . . . . . . . . . . . . . . . . . . . . (17,372 ) (6,645 ) (10,727 )
Less: Reclassification adjustments for net gains on securities
realized in net income . . . . . . . . . . . . . . . . . . . . . . . . . . . . . . . . (26,247 ) (10,240 ) (16,007 )
Other comprehensive loss . . . . . . . . . . . . . . . . . . . . . . . . . . . . . . . . . . . $ (45,520 ) $ (17,627 ) $ (27,893)
2003
($ in thousands)
Before-Tax
Amount
Tax Expense/
(Benefit)
Net-of-Tax
Amount
Net unrealized holding gains on securities arising
during period . . . . . . . . . . . . . . . . . . . . . . . . . . . . . . . . . . . . . . . $ 14,470 $ 5,539 $ 8,931
Minimum pension liability . . . . . . . . . . . . . . . . . . . . . . . . . . . . . . . 34,935 13,373 21,562
Other comprehensive income . . . . . . . . . . . . . . . . . . . . . . . . . . . . . . . . $ 49,405 $ 18,912 $ 30,493
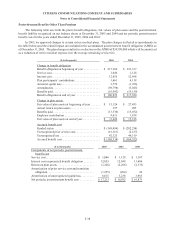
(22) SEGMENT INFORMATION:
We operate in two segments, Frontier and ELI (a CLEC). The Frontier segment provides both regulated and
unregulated communications services to residential, business and wholesale customers and is typically the incumbent
provider in its service areas. ELI provides telecommunications services, principally to businesses. ELI frequently
obtains the “last mile” access to customers through arrangements with the applicable ILEC.
As permitted by SFAS No. 131, we have utilized the aggregation criteria in combining our markets because all
of our Frontier properties share similar economic characteristics, in that they provide the same products and services
to similar customers using comparable technologies in all of the states that we operate in. The regulatory structure
is generally similar. Differences in the regulatory regime of a particular state do not impact the economic
characteristics or operating results of a particular property.
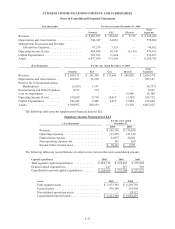
($ in thousands) For the year ended December 31, 2005
Frontier ELI
Total
Segments
Revenue . . . . . . . . . . . . . . . . . . . . . . . . . . . . . . . . . . . . . . . . . . . . . . . . . $ 2,003,318 $ 159,161 $ 2,162,479
Depreciation and Amortization . . . . . . . . . . . . . . . . . . . . . . . . . . . . . . 516,982 24,977 541,959
Operating Income . . . . . . . . . . . . . . . . . . . . . . . . . . . . . . . . . . . . . . . . . 588,543 18,306 606,849
Capital Expenditures . . . . . . . . . . . . . . . . . . . . . . . . . . . . . . . . . . . . . . 252,213 16,099 268,312
Assets . . . . . . . . . . . . . . . . . . . . . . . . . . . . . . . . . . . . . . . . . . . . . . . . . . 5,805,423 168,342 5,973,765