Frontier Communications 2005 Annual Report Download - page 82
Download and view the complete annual report
Please find page 82 of the 2005 Frontier Communications annual report below. You can navigate through the pages in the report by either clicking on the pages listed below, or by using the keyword search tool below to find specific information within the annual report.-
 1
1 -
2
-
3
-
4
-
5
-
6
-
7
-
8
-
9
-
10
-
11
-
12
-
13
-
14
-
15
-
16
-
17
-
18
-
19
-
20
-
21
-
22
-
23
-
24
-
25
-
26
-
27
-
28
-
29
-
30
-
31
-
32
-
33
-
34
-
35
-
36
-
37
-
38
-
39
-
40
-
41
-
42
-
43
-
44
-
45
-
46
-
47
-
48
-
49
-
50
-
51
-
52
-
53
-
54
-
55
-
56
-
57
-
58
-
59
-
60
-
61
-
62
-
63
-
64
-
65
-
66
-
67
-
68
-
69
-
70
-
71
-
 72
72 -
 73
73 -
 74
74 -
 75
75 -
 76
76 -
 77
77 -
 78
78 -
 79
79 -
 80
80 -
 81
81 -
 82
82 -
 83
83 -
 84
84 -
 85
85 -
 86
86 -
 87
87 -
 88
88 -
 89
89 -
 90
90 -
 91
91 -
 92
92 -
93
-
94
-
95
-
96
 |
 |

F-33
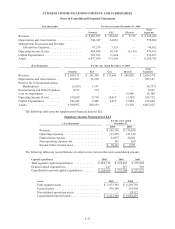
CITIZENS COMMUNICATIONS COMPANY AND SUBSIDIARIES
Notes to Consolidated Financial Statements
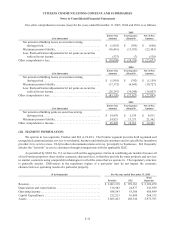
($ in thousands) For the year ended December 31, 2004
Frontier ELI Electric
Total
Segments
Revenue . . . . . . . . . . . . . . . . . . . . . . . . . . . . . . . . . . . . $ 2,002,657 $ 156,030 $ 9,735 $ 2,168,422
Depreciation and Amortization . . . . . . . . . . . . . . . . . 546,747 24,061 — 570,808
Management Succession and Strategic
Alternatives Expenses . . . . . . . . . . . . . . . . . . . . . . 87,279 3,353 — 90,632
Operating Income (Loss) . . . . . . . . . . . . . . . . . . . . . . 468,889 10,350 (3,134) 476,105
Capital Expenditures . . . . . . . . . . . . . . . . . . . . . . . . . 263,193 11,644 — 274,837
Assets . . . . . . . . . . . . . . . . . . . . . . . . . . . . . . . . . . . . . 6,077,424 173,369 — 6,250,793
($ in thousands) For the year ended December 31, 2003
Frontier ELI Gas Electric
Total
Segments
Revenue . . . . . . . . . . . . . . . . . . . . . $ 2,020,171 $ 165,389 $ 137,686 $ 100,928 $ 2,424,174
Depreciation and Amortization . . 569,651 23,510 — — 593,161
Reserve for Telecommunications
Bankruptcies . . . . . . . . . . . . . . (5,524 ) 1,147 — — (4,377 )
Restructuring and Other Expenses 9,373 314 — — 9,687
Loss on Impairment . . . . . . . . . . . — — — 15,300 15,300
Operating Income (Loss) . . . . . . . 530,368 9,710 14,013 (3,359 ) 550,732
Capital Expenditures . . . . . . . . . . 243,445 9,496 9,877 13,984 276,802
Assets . . . . . . . . . . . . . . . . . . . . . . 6,399,953 184,559 — 23,130 6,607,642
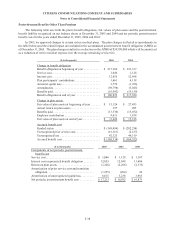
The following table presents supplemental financial data for ELI.
Summary Income Statement for ELI
( $ in thousands)
For the years ended
December 31,
2005 2004
Revenue . . . . . . . . . . . . . . . . . . . . . . . . . . . . . . . . . . . . $ 159,161 $ 156,030
Operating expenses . . . . . . . . . . . . . . . . . . . . . . . . . . 115,878 121,619
Depreciation expense . . . . . . . . . . . . . . . . . . . . . . . . . 24,977 24,061
Non-operating expense, net . . . . . . . . . . . . . . . . . . . . 185 629
Income before income taxes . . . . . . . . . . . . . . . . . . . . $ 18,121 $ 9,721
The following tables are reconciliations of certain sector items to the total consolidated amount.
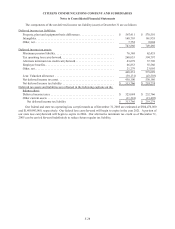
Capital Expenditures 2005 2004 2003
Total segment capital expenditures . . . . . . . . . . . . . . $ 268,312 $ 274,837 $ 276,802
General capital expenditures . . . . . . . . . . . . . . . . . . . 147 367 569
Consolidated reported capital expenditures . . . . . . . . $ 268,459 $ 275,204 $ 277,371
Assets 2005 2004
Total segment assets . . . . . . . . . . . . . . . . . . . . . . . . . . $ 5,973,765 $ 6,250,793
General assets . . . . . . . . . . . . . . . . . . . . . . . . . . . . . . . 438,344 393,504
Discontinued operations assets . . . . . . . . . . . . . . . . . — 24,122
Consolidated reported assets . . . . . . . . . . . . . . . . . . . $ 6,412,109 $ 6,668,419