Frontier Communications 2005 Annual Report Download - page 37
Download and view the complete annual report
Please find page 37 of the 2005 Frontier Communications annual report below. You can navigate through the pages in the report by either clicking on the pages listed below, or by using the keyword search tool below to find specific information within the annual report.-
 1
1 -
2
-
3
-
4
-
5
-
6
-
7
-
8
-
9
-
10
-
11
-
12
-
13
-
14
-
15
-
16
-
17
-
18
-
19
-
20
-
21
-
22
-
23
-
24
-
25
-
26
-
 27
27 -
 28
28 -
 29
29 -
 30
30 -
 31
31 -
 32
32 -
 33
33 -
 34
34 -
 35
35 -
 36
36 -
 37
37 -
 38
38 -
 39
39 -
 40
40 -
 41
41 -
 42
42 -
 43
43 -
 44
44 -
 45
45 -
 46
46 -
 47
47 -
48
-
49
-
50
-
51
-
52
-
53
-
54
-
55
-
56
-
57
-
58
-
59
-
60
-
61
-
62
-
63
-
64
-
65
-
66
-
67
-
68
-
69
-
70
-
71
-
72
-
73
-
74
-
75
-
76
-
77
-
78
-
79
-
80
-
81
-
82
-
83
-
84
-
85
-
86
-
87
-
88
-
89
-
90
-
91
-
92
-
93
-
94
-
95
-
96
 |
 |

35
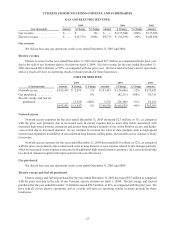
CITIZENS COMMUNICATIONS COMPANY AND SUBSIDIARIES
GAS AND ELECTRIC REVENUE
2005 2004 2003
($ in thousands) Amount $ Change % Change Amount $ Change % Change Amount
Gas revenue . . . . . . . . . . . . . . . . . $ — $ — 0% $ — $(137,686) -100% $ 137,686
Electric revenue . . . . . . . . . . . . . $ — $ (9,735) -100% $ 9,735 $ (91,193) -90% $ 100,928
Gas revenue
We did not have any gas operations in the years ended December 31, 2005 and 2004.
Electric revenue
Electric revenue for the year ended December 31, 2005 decreased $9.7 million as compared with the prior year
due to the sale of our Vermont electric division on April 1, 2004. Electric revenue for the year ended December 31,
2004 decreased $91.2 million, or 90%, as compared with the prior year. We have sold all of our electric operations
and as a result will have no operating results in future periods for these businesses.
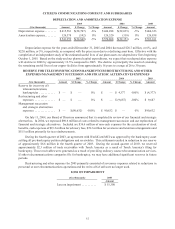
COST OF SERVICES
($ in thousands)
2005 2004 2003
Amount $ Change % Change Amount $ Change % Change Amount
Network access . . . . . . . . . . . $ 195,491 $ 2,076 1% $ 193,415 $ (26,006 ) -12% $ 219,421
Gas purchased . . . . . . . . . . . . — — 0% — (82,311 ) -100% 82,311
Electric energy and fuel oil
purchased . . . . . . . . . . . . — (5,523) -100% 5,523 (58,308) -91% 63,831
$ 195,491 $ (3,447 ) -2% $ 198,938 $(166,625) -46% $ 365,563
Network access
Network access expenses for the year ended December 31, 2005 increased $2.1 million, or 1%, as compared
with the prior year primarily due to increased costs in circuit expense due to more data traffic associated with
increased high-speed internet customers and greater long distance minutes of use in the Frontier sector, and higher
costs at ELI due to increased demand. As we continue to increase our sales of data products such as high-speed
internet and expand the availability of our unlimited long distance calling plans, our network access expense is likely
to increase.
Network access expenses for the year ended December 31, 2004 decreased $26.0 million, or 12%, as compared
with the prior year primarily due to decreased costs in long distance access expense related to rate changes partially
offset by increased circuit expense associated with additional high-speed internet customers. ELI costs declined due
to a drop in demand coupled with improved network cost efficiencies.
Gas purchased
We did not have any gas operations in the years ended December 31, 2005 and 2004.
Electric energy and fuel oil purchased
Electric energy and fuel oil purchased for the year ended December 31, 2005 decreased $5.5 million as compared
with the prior year due to the sale of our Vermont electric division on April 1, 2004. Electric energy and fuel oil
purchased for the year ended December 31, 2004 decreased $58.3 million, or 91%, as compared with the prior year. We
have sold all of our electric operations and as a result will have no operating results in future periods for these
businesses.