Delta Airlines 2012 Annual Report Download - page 99
Download and view the complete annual report
Please find page 99 of the 2012 Delta Airlines annual report below. You can navigate through the pages in the report by either clicking on the pages listed below, or by using the keyword search tool below to find specific information within the annual report.-
 1
1 -
2
-
3
-
4
-
5
-
6
-
7
-
8
-
9
-
10
-
11
-
12
-
13
-
14
-
15
-
16
-
17
-
18
-
19
-
20
-
21
-
22
-
23
-
24
-
25
-
26
-
27
-
28
-
29
-
30
-
31
-
32
-
33
-
34
-
35
-
36
-
37
-
38
-
39
-
40
-
41
-
42
-
43
-
44
-
45
-
46
-
47
-
48
-
49
-
50
-
51
-
52
-
53
-
54
-
55
-
56
-
57
-
58
-
59
-
60
-
61
-
62
-
63
-
64
-
65
-
66
-
67
-
68
-
69
-
70
-
71
-
72
-
73
-
74
-
75
-
76
-
77
-
78
-
79
-
80
-
81
-
82
-
83
-
84
-
85
-
86
-
87
-
88
-
 89
89 -
 90
90 -
 91
91 -
 92
92 -
 93
93 -
 94
94 -
 95
95 -
 96
96 -
 97
97 -
 98
98 -
 99
99 -
 100
100 -
 101
101 -
 102
102 -
 103
103 -
 104
104 -
 105
105 -
 106
106 -
 107
107 -
 108
108 -
 109
109 -
110
-
111
-
112
-
113
-
114
-
115
-
116
-
117
-
118
-
119
-
120
-
121
-
122
-
123
-
124
-
125
-
126
-
127
-
128
-
129
-
130
-
131
-
132
-
133
-
134
-
135
-
136
-
137
-
138
-
139
-
140
-
141
-
142
-
143
-
144
-
145
-
146
-
147
-
148
-
149
-
150
-
151
-
152
-
153
-
154
-
155
-
156
-
157
-
158
-
159
-
160
-
161
-
162
-
163
-
164
-
165
-
166
-
167
-
168
-
169
-
170
-
171
-
172
-
173
-
174
-
175
-
176
-
177
-
178
-
179
-
180
-
181
-
182
-
183
-
184
-
185
-
186
-
187
-
188
-
189
-
190
-
191
-
192
-
193
-
194
-
195
-
196
-
197
-
198
-
199
-
200
-
201
-
202
-
203
-
204
-
205
-
206
-
207
-
208
-
209
-
210
-
211
-
212
-
213
-
214
-
215
-
216
-
217
-
218
-
219
-
220
-
221
-
222
-
223
-
224
-
225
-
226
-
227
-
228
-
229
-
230
-
231
-
232
-
233
-
234
-
235
-
236
-
237
-
238
-
239
-
240
-
241
-
242
-
243
-
244
-
245
-
246
-
247
-
248
-
249
-
250
-
251
-
252
-
253
-
254
-
255
-
256
-
257
-
258
-
259
-
260
-
261
-
262
-
263
-
264
-
265
-
266
-
267
-
268
-
269
-
270
-
271
-
272
-
273
-
274
-
275
-
276
-
277
-
278
-
279
-
280
-
281
-
282
-
283
-
284
-
285
-
286
-
287
-
288
-
289
-
290
-
291
-
292
-
293
-
294
-
295
-
296
-
297
-
298
-
299
-
300
-
301
-
302
-
303
-
304
-
305
-
306
-
307
-
308
-
309
-
310
-
311
-
312
-
313
-
314
-
315
-
316
-
317
-
318
-
319
-
320
-
321
-
322
-
323
-
324
-
325
-
326
-
327
-
328
-
329
-
330
-
331
-
332
-
333
-
334
-
335
-
336
-
337
-
338
-
339
-
340
-
341
-
342
-
343
-
344
-
345
-
346
-
347
-
348
-
349
-
350
-
351
-
352
-
353
-
354
-
355
-
356
-
357
-
358
-
359
-
360
-
361
-
362
-
363
-
364
-
365
-
366
-
367
-
368
-
369
-
370
-
371
-
372
-
373
-
374
-
375
-
376
-
377
-
378
-
379
-
380
-
381
-
382
-
383
-
384
-
385
-
386
-
387
-
388
-
389
-
390
-
391
-
392
-
393
-
394
-
395
-
396
-
397
-
398
-
399
-
400
-
401
-
402
-
403
-
404
-
405
-
406
-
407
-
408
-
409
-
410
-
411
-
412
-
413
-
414
-
415
-
416
-
417
-
418
-
419
-
420
-
421
-
422
-
423
-
424
 |
 |

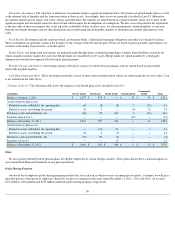
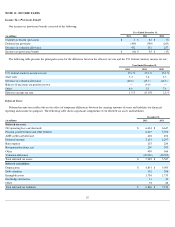
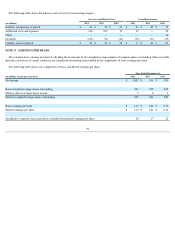
NOTE 16 . RESTRUCTURING AND OTHER ITEMS
The following table shows amounts recorded in restructuring and other items on our Consolidated Statements of Operations:
Facilities, Fleet and Other . We recorded impairment and restructuring charges of $293 million during 2012 primarily related to our domestic
fleet restructuring initiative. Under the domestic fleet restructuring initiative, we are focused on removing older, less efficient aircraft from our fleet
and replacing them with B-737-900ER, B-717-200 and CRJ-900 aircraft that we have committed to acquire. These restructuring charges in 2012 are
related to older, retiring aircraft, including remaining lease payments for grounded aircraft, the acceleration of aircraft depreciation and lease return
costs during the period and related equipment disposals. As an extension of our domestic fleet restructuring initiative and our desire to reduce the
number of regional jets in our network, we shut down the operations of Comair, a wholly-owned regional airline subsidiary, as of September 29,
2012. The restructuring charges in 2012 also include amounts associated with the closure of Comair.
During 2011, we recorded charges related to consolidation of facilities and certain aircraft that were removed from our operations.
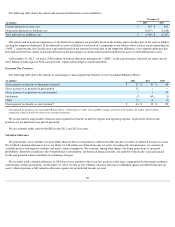
In 2010, we recorded asset impairment charges related to the Comair fleet reduction initiative and our retired dedicated freighter aircraft. The
Comair fleet reduction initiative was to retire older, less-efficient CRJ-100/200 50-seat aircraft. In evaluating these aircraft for impairment, we
estimated their fair value by utilizing a market approach considering (1) published market data generally accepted in the airline industry, (2) recent
market transactions, where available, (3) the current and projected supply of and demand for these aircraft and (4) the condition and age of the
aircraft. Based on our fair value assessments, these aircraft had an estimated fair value of $97 million and are classified in Level 3 of the three-tier
fair value hierarchy.
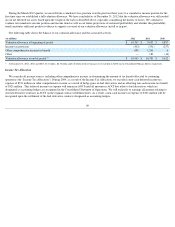
Severance and Related Costs . We recognized a severance charge of $237 million for the year ended December 31, 2012 , which includes $116
million of special termination benefits (see Note 11 ). We offered voluntary severance programs in which more than 2,000 employees elected to
participate. These participants became eligible for retiree healthcare benefits. Also, we accrued $66 million in severance and related costs in 2012 to
provide severance benefits to Comair's 1,700 employees, as we ceased operations at the carrier.
During 2011, we recorded charges associated primarily with voluntary workforce reduction programs to align staffing with expected future
capacity.
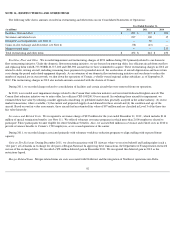
Gain on Slot Exchange. During December 2011, we closed transactions with US Airways where we received takeoff and landing rights (each a
"slot pair") at LaGuardia in exchange for slot pairs at Reagan National. In approving these transactions, the Department of Transportation restricted
our use of the exchanged slots. We recorded a $78 million deferred gain in December 2011. We recognized this deferred gain in 2012 as the
restrictions lapsed.
Merger-Related Items . Merger-related items are costs associated with Northwest and the integration of Northwest operations into Delta.
92
Year Ended December 31,
(in millions) 2012 2011 2010
Facilities, fleet and other
$
293
$
135
$
202
Severance and related costs
237
100
15
Intangible asset impairments (see Note 6)
—
50
—
Gains on slot exchange and divestiture (see Note 6)
(78
)
(43
)
—
Merger-related items
—
—
233
Total restructuring and other items
$
452
$
242
$
450