Delta Airlines 2012 Annual Report Download - page 48
Download and view the complete annual report
Please find page 48 of the 2012 Delta Airlines annual report below. You can navigate through the pages in the report by either clicking on the pages listed below, or by using the keyword search tool below to find specific information within the annual report.-
 1
1 -
2
-
3
-
4
-
5
-
6
-
7
-
8
-
9
-
10
-
11
-
12
-
13
-
14
-
15
-
16
-
17
-
18
-
19
-
20
-
21
-
22
-
23
-
24
-
25
-
26
-
27
-
28
-
29
-
30
-
31
-
32
-
33
-
34
-
35
-
36
-
37
-
 38
38 -
 39
39 -
 40
40 -
 41
41 -
 42
42 -
 43
43 -
 44
44 -
 45
45 -
 46
46 -
 47
47 -
 48
48 -
 49
49 -
 50
50 -
 51
51 -
 52
52 -
 53
53 -
 54
54 -
 55
55 -
 56
56 -
 57
57 -
 58
58 -
59
-
60
-
61
-
62
-
63
-
64
-
65
-
66
-
67
-
68
-
69
-
70
-
71
-
72
-
73
-
74
-
75
-
76
-
77
-
78
-
79
-
80
-
81
-
82
-
83
-
84
-
85
-
86
-
87
-
88
-
89
-
90
-
91
-
92
-
93
-
94
-
95
-
96
-
97
-
98
-
99
-
100
-
101
-
102
-
103
-
104
-
105
-
106
-
107
-
108
-
109
-
110
-
111
-
112
-
113
-
114
-
115
-
116
-
117
-
118
-
119
-
120
-
121
-
122
-
123
-
124
-
125
-
126
-
127
-
128
-
129
-
130
-
131
-
132
-
133
-
134
-
135
-
136
-
137
-
138
-
139
-
140
-
141
-
142
-
143
-
144
-
145
-
146
-
147
-
148
-
149
-
150
-
151
-
152
-
153
-
154
-
155
-
156
-
157
-
158
-
159
-
160
-
161
-
162
-
163
-
164
-
165
-
166
-
167
-
168
-
169
-
170
-
171
-
172
-
173
-
174
-
175
-
176
-
177
-
178
-
179
-
180
-
181
-
182
-
183
-
184
-
185
-
186
-
187
-
188
-
189
-
190
-
191
-
192
-
193
-
194
-
195
-
196
-
197
-
198
-
199
-
200
-
201
-
202
-
203
-
204
-
205
-
206
-
207
-
208
-
209
-
210
-
211
-
212
-
213
-
214
-
215
-
216
-
217
-
218
-
219
-
220
-
221
-
222
-
223
-
224
-
225
-
226
-
227
-
228
-
229
-
230
-
231
-
232
-
233
-
234
-
235
-
236
-
237
-
238
-
239
-
240
-
241
-
242
-
243
-
244
-
245
-
246
-
247
-
248
-
249
-
250
-
251
-
252
-
253
-
254
-
255
-
256
-
257
-
258
-
259
-
260
-
261
-
262
-
263
-
264
-
265
-
266
-
267
-
268
-
269
-
270
-
271
-
272
-
273
-
274
-
275
-
276
-
277
-
278
-
279
-
280
-
281
-
282
-
283
-
284
-
285
-
286
-
287
-
288
-
289
-
290
-
291
-
292
-
293
-
294
-
295
-
296
-
297
-
298
-
299
-
300
-
301
-
302
-
303
-
304
-
305
-
306
-
307
-
308
-
309
-
310
-
311
-
312
-
313
-
314
-
315
-
316
-
317
-
318
-
319
-
320
-
321
-
322
-
323
-
324
-
325
-
326
-
327
-
328
-
329
-
330
-
331
-
332
-
333
-
334
-
335
-
336
-
337
-
338
-
339
-
340
-
341
-
342
-
343
-
344
-
345
-
346
-
347
-
348
-
349
-
350
-
351
-
352
-
353
-
354
-
355
-
356
-
357
-
358
-
359
-
360
-
361
-
362
-
363
-
364
-
365
-
366
-
367
-
368
-
369
-
370
-
371
-
372
-
373
-
374
-
375
-
376
-
377
-
378
-
379
-
380
-
381
-
382
-
383
-
384
-
385
-
386
-
387
-
388
-
389
-
390
-
391
-
392
-
393
-
394
-
395
-
396
-
397
-
398
-
399
-
400
-
401
-
402
-
403
-
404
-
405
-
406
-
407
-
408
-
409
-
410
-
411
-
412
-
413
-
414
-
415
-
416
-
417
-
418
-
419
-
420
-
421
-
422
-
423
-
424
 |
 |

Identifiable Intangible Assets. Our identifiable intangible assets had a net carrying amount of $4.7 billion at December 31, 2012 . Indefinite-lived
assets are not amortized and consist primarily of routes, slots, the Delta tradename and assets related to SkyTeam and collaborative arrangements.
In 2012, we determined that there was no indication that our indefinite-lived intangible assets were impaired based upon our assessments. These
assessments included analyses and weighting of all relevant factors, including the significant inputs and key assumptions which impact the fair value
of our indefinite-lived intangible assets.
Long
-Lived Assets
Our flight equipment and other long-lived assets have a recorded value of $20.7 billion at December 31, 2012 . This value is based on various
factors, including the assets' estimated useful lives and salvage values. We record impairment losses on flight equipment and other long-lived assets
used in operations when events and circumstances indicate the assets may be impaired and the estimated future cash flows generated by those assets
are less than their carrying amounts. Factors which could cause impairment include, but are not limited to, (1) a decision to permanently remove
flight equipment or other long-lived assets from operations, (2) significant changes in the estimated useful life, (3) significant changes in projected
cash flows, (4) permanent and significant declines in fleet fair values and (5) changes to the regulatory environment. For long-lived assets held for
sale, we discontinue depreciation and record impairment losses when the carrying amount of these assets is greater than the fair value less the cost to
sell.
To determine whether impairments exist for aircraft used in operations, we group assets at the fleet-
type level (the lowest level for which there are
identifiable cash flows) and then estimate future cash flows based on projections of capacity, passenger mile yield, fuel costs, labor costs and other
relevant factors. If an impairment occurs, the impairment loss recognized is the amount by which the aircraft's carrying amount exceeds its estimated
fair value. We estimate aircraft fair values using published sources, appraisals and bids received from third parties, as available.
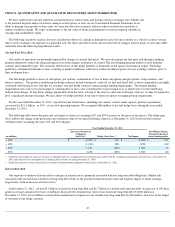
Income Tax Valuation Allowance
We periodically assess whether it is more likely than not that we will generate sufficient taxable income to realize our deferred income tax assets.
We establish valuation allowances if it is not likely we will realize our deferred income tax assets. In making this determination, we consider all
available positive and negative evidence and make certain assumptions. We consider, among other things, our future projections of sustained
profitability, deferred tax liabilities, the overall business environment, our historical financial results, our industry's historically cyclical financial
results and potential current and future tax planning strategies.
We recorded a full valuation allowance in 2004 due to our cumulative three year loss position at that time, compounded by the negative industry-
wide business trends and outlook. At December 31, 2012, we had an $11.0 billion valuation allowance established against our deferred income tax
assets, which represents a full valuation allowance against our net deferred income tax asset.
During the March 2012 quarter, we moved from a cumulative loss position over the previous three years to a cumulative income position for the
first time since we established a full valuation allowance. We have concluded as of December 31, 2012 that the valuation allowance was still needed
on our net deferred tax assets based upon the weight of the factors described above, especially considering the history of losses. We continue to
evaluate our cumulative income position and income trend as well as our future projections of sustained profitability and whether this profitability
trend constitutes sufficient positive evidence to support a reversal of our valuation allowance (in full or in part).
Defined Benefit Pension Plans
We sponsor defined benefit pension plans for eligible employees and retirees. These plans are closed to new entrants and frozen for future benefit
accruals. As of December 31, 2012 , the unfunded benefit obligation for these plans recorded on our Consolidated Balance Sheet was $13.3 billion .
During 2012 , we contributed $697 million to these plans and recorded $368 million of expense in salaries and related costs on our Consolidated
Statement of Operations. In 2013, we estimate we will contribute approximately $675 million to these plans and that our expense will be
approximately $350 million. The most critical assumptions impacting our defined benefit pension plan obligations and expenses are the discount rate
and the expected long-term rate of return on the plan assets.
43