Delta Airlines 2012 Annual Report Download - page 34
Download and view the complete annual report
Please find page 34 of the 2012 Delta Airlines annual report below. You can navigate through the pages in the report by either clicking on the pages listed below, or by using the keyword search tool below to find specific information within the annual report.-
 1
1 -
2
-
3
-
4
-
5
-
6
-
7
-
8
-
9
-
10
-
11
-
12
-
13
-
14
-
15
-
16
-
17
-
18
-
19
-
20
-
21
-
22
-
23
-
 24
24 -
 25
25 -
 26
26 -
 27
27 -
 28
28 -
 29
29 -
 30
30 -
 31
31 -
 32
32 -
 33
33 -
 34
34 -
 35
35 -
 36
36 -
 37
37 -
 38
38 -
 39
39 -
 40
40 -
 41
41 -
 42
42 -
 43
43 -
 44
44 -
45
-
46
-
47
-
48
-
49
-
50
-
51
-
52
-
53
-
54
-
55
-
56
-
57
-
58
-
59
-
60
-
61
-
62
-
63
-
64
-
65
-
66
-
67
-
68
-
69
-
70
-
71
-
72
-
73
-
74
-
75
-
76
-
77
-
78
-
79
-
80
-
81
-
82
-
83
-
84
-
85
-
86
-
87
-
88
-
89
-
90
-
91
-
92
-
93
-
94
-
95
-
96
-
97
-
98
-
99
-
100
-
101
-
102
-
103
-
104
-
105
-
106
-
107
-
108
-
109
-
110
-
111
-
112
-
113
-
114
-
115
-
116
-
117
-
118
-
119
-
120
-
121
-
122
-
123
-
124
-
125
-
126
-
127
-
128
-
129
-
130
-
131
-
132
-
133
-
134
-
135
-
136
-
137
-
138
-
139
-
140
-
141
-
142
-
143
-
144
-
145
-
146
-
147
-
148
-
149
-
150
-
151
-
152
-
153
-
154
-
155
-
156
-
157
-
158
-
159
-
160
-
161
-
162
-
163
-
164
-
165
-
166
-
167
-
168
-
169
-
170
-
171
-
172
-
173
-
174
-
175
-
176
-
177
-
178
-
179
-
180
-
181
-
182
-
183
-
184
-
185
-
186
-
187
-
188
-
189
-
190
-
191
-
192
-
193
-
194
-
195
-
196
-
197
-
198
-
199
-
200
-
201
-
202
-
203
-
204
-
205
-
206
-
207
-
208
-
209
-
210
-
211
-
212
-
213
-
214
-
215
-
216
-
217
-
218
-
219
-
220
-
221
-
222
-
223
-
224
-
225
-
226
-
227
-
228
-
229
-
230
-
231
-
232
-
233
-
234
-
235
-
236
-
237
-
238
-
239
-
240
-
241
-
242
-
243
-
244
-
245
-
246
-
247
-
248
-
249
-
250
-
251
-
252
-
253
-
254
-
255
-
256
-
257
-
258
-
259
-
260
-
261
-
262
-
263
-
264
-
265
-
266
-
267
-
268
-
269
-
270
-
271
-
272
-
273
-
274
-
275
-
276
-
277
-
278
-
279
-
280
-
281
-
282
-
283
-
284
-
285
-
286
-
287
-
288
-
289
-
290
-
291
-
292
-
293
-
294
-
295
-
296
-
297
-
298
-
299
-
300
-
301
-
302
-
303
-
304
-
305
-
306
-
307
-
308
-
309
-
310
-
311
-
312
-
313
-
314
-
315
-
316
-
317
-
318
-
319
-
320
-
321
-
322
-
323
-
324
-
325
-
326
-
327
-
328
-
329
-
330
-
331
-
332
-
333
-
334
-
335
-
336
-
337
-
338
-
339
-
340
-
341
-
342
-
343
-
344
-
345
-
346
-
347
-
348
-
349
-
350
-
351
-
352
-
353
-
354
-
355
-
356
-
357
-
358
-
359
-
360
-
361
-
362
-
363
-
364
-
365
-
366
-
367
-
368
-
369
-
370
-
371
-
372
-
373
-
374
-
375
-
376
-
377
-
378
-
379
-
380
-
381
-
382
-
383
-
384
-
385
-
386
-
387
-
388
-
389
-
390
-
391
-
392
-
393
-
394
-
395
-
396
-
397
-
398
-
399
-
400
-
401
-
402
-
403
-
404
-
405
-
406
-
407
-
408
-
409
-
410
-
411
-
412
-
413
-
414
-
415
-
416
-
417
-
418
-
419
-
420
-
421
-
422
-
423
-
424
 |
 |

ITEM 7. MANAGEMENT'S DISCUSSION AND ANALYSIS OF FINANCIAL CONDITION AND RESULTS OF OPERATIONS
Financial Highlights - 2012 Compared to 2011
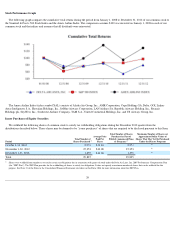
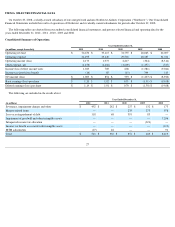
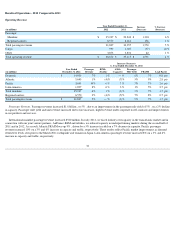
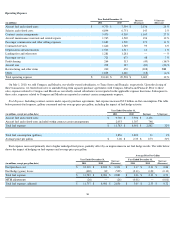
Our net income for 2012 was $1.0 billion , or $1.19 per diluted share. Total operating revenue increased $1.6 billion , or 4% , over 2011 ,
primarily due to higher passenger revenue due to yield improvement. Fuel expense, including our contract carriers under capacity purchase
agreements, increased due to a 6% increase in our average price per gallon, despite a 2% decrease in consumption.
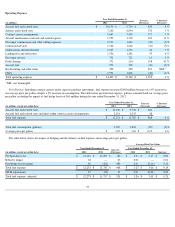
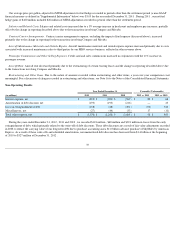
Passenger revenue increased $1.6 billion due to a 5% year over year improvement in passenger mile yield on flat traffic, while capacity declined
2% . Passenger revenue per available seat mile ("PRASM") increased 7% over 2011 , reflecting higher revenue under corporate travel contracts and
improvements in our products and services.
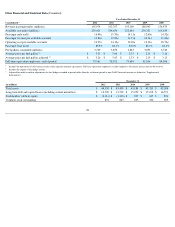
Total operating expense increased $1.4 billion over 2011
, driven primarily by higher fuel expense and salaries and related costs. Our fuel expense
increased $468 million (including our contract carriers under capacity purchase agreements) compared to 2011 due to a 6% increase in our average
price per gallon, despite a 2% decrease in consumption. During 2012, we recorded losses of $66 million due to changes in the fair value of our fuel
hedge portfolio. Excluding mark-to-market adjustments recorded in periods other than the settlement period ("MTM adjustments"), our average fuel
price for the year was $3.26 per gallon, compared to $3.05 per gallon for 2011 .
Our consolidated operating cost per available seat mile ("CASM") for 2012 increased 6% to $14.97 cent s, primarily reflecting increased fuel
price. For 2012 , CASM-Ex was $8.92 cent s, or 5% higher than 2011 . The non-GAAP financial measures used in this section are defined in
"Supplemental Information" below.
Company Initiatives
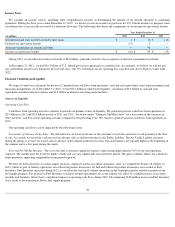
Strengthening the Balance Sheet
We will continue to focus on cash flow generation with the goal of further strengthening our balance sheet. We finished 2012 with $5.2 billion in
unrestricted liquidity (consisting of cash, cash equivalents, short-term investments and undrawn revolving credit facility capacity). During 2012, we
generated $2.5 billion in cash from operating activities, and reduced debt by $1.1 billion and funded capital expenditures while maintaining a solid
liquidity position.
Structural Cost Initiatives
We implemented a $1 billion structural cost initiatives program. These initiatives are designed to improve our cost efficiency while maintaining
our operational performance and revenue generation and include:
• Domestic fleet restructuring to retire older, less efficient aircraft from our fleet;
• Maintenance redesign focusing on improving our processes and resource management;
• Distribution platforms to increase the use of cost effective and value-added distribution channels such as delta.com;
• Staffing efficiency to generate higher productivity levels through technology and improved staffing models; and
• Other costs to improve network efficiency and to reduce transportation expense.
We anticipate realizing the benefits of the structural cost initiatives in 2013, with CASM-Ex growth moderating in the second half of 2013, and
the benefits of the initiatives increasing through 2015.
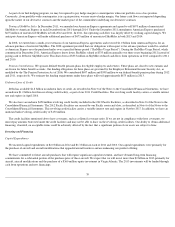
Domestic Fleet Restructuring
Domestic fleet restructuring is a key part of our structural cost initiatives, and is focused on lowering unit costs while investing in our fleet to
enhance the customer experience. We are restructuring our domestic fleet by reducing our 50-seat regional flying and replacing other older, less cost
effective aircraft with newer, more efficient aircraft. Recent agreements with SkyWest Airlines, Inc., Pinnacle Airlines, Inc. and Bombardier
Aerospace have produced a path for us to eliminate more than 200 50-seat aircraft. We are replacing these aircraft and older B-757-200 aircraft with
more efficient and customer preferred CRJ-900, B-717-200 and B-737-900ER aircraft.
29