Delta Airlines 2012 Annual Report Download - page 40
Download and view the complete annual report
Please find page 40 of the 2012 Delta Airlines annual report below. You can navigate through the pages in the report by either clicking on the pages listed below, or by using the keyword search tool below to find specific information within the annual report.-
 1
1 -
2
-
3
-
4
-
5
-
6
-
7
-
8
-
9
-
10
-
11
-
12
-
13
-
14
-
15
-
16
-
17
-
18
-
19
-
20
-
21
-
22
-
23
-
24
-
25
-
26
-
27
-
28
-
29
-
 30
30 -
 31
31 -
 32
32 -
 33
33 -
 34
34 -
 35
35 -
 36
36 -
 37
37 -
 38
38 -
 39
39 -
 40
40 -
 41
41 -
 42
42 -
 43
43 -
 44
44 -
 45
45 -
 46
46 -
 47
47 -
 48
48 -
 49
49 -
 50
50 -
51
-
52
-
53
-
54
-
55
-
56
-
57
-
58
-
59
-
60
-
61
-
62
-
63
-
64
-
65
-
66
-
67
-
68
-
69
-
70
-
71
-
72
-
73
-
74
-
75
-
76
-
77
-
78
-
79
-
80
-
81
-
82
-
83
-
84
-
85
-
86
-
87
-
88
-
89
-
90
-
91
-
92
-
93
-
94
-
95
-
96
-
97
-
98
-
99
-
100
-
101
-
102
-
103
-
104
-
105
-
106
-
107
-
108
-
109
-
110
-
111
-
112
-
113
-
114
-
115
-
116
-
117
-
118
-
119
-
120
-
121
-
122
-
123
-
124
-
125
-
126
-
127
-
128
-
129
-
130
-
131
-
132
-
133
-
134
-
135
-
136
-
137
-
138
-
139
-
140
-
141
-
142
-
143
-
144
-
145
-
146
-
147
-
148
-
149
-
150
-
151
-
152
-
153
-
154
-
155
-
156
-
157
-
158
-
159
-
160
-
161
-
162
-
163
-
164
-
165
-
166
-
167
-
168
-
169
-
170
-
171
-
172
-
173
-
174
-
175
-
176
-
177
-
178
-
179
-
180
-
181
-
182
-
183
-
184
-
185
-
186
-
187
-
188
-
189
-
190
-
191
-
192
-
193
-
194
-
195
-
196
-
197
-
198
-
199
-
200
-
201
-
202
-
203
-
204
-
205
-
206
-
207
-
208
-
209
-
210
-
211
-
212
-
213
-
214
-
215
-
216
-
217
-
218
-
219
-
220
-
221
-
222
-
223
-
224
-
225
-
226
-
227
-
228
-
229
-
230
-
231
-
232
-
233
-
234
-
235
-
236
-
237
-
238
-
239
-
240
-
241
-
242
-
243
-
244
-
245
-
246
-
247
-
248
-
249
-
250
-
251
-
252
-
253
-
254
-
255
-
256
-
257
-
258
-
259
-
260
-
261
-
262
-
263
-
264
-
265
-
266
-
267
-
268
-
269
-
270
-
271
-
272
-
273
-
274
-
275
-
276
-
277
-
278
-
279
-
280
-
281
-
282
-
283
-
284
-
285
-
286
-
287
-
288
-
289
-
290
-
291
-
292
-
293
-
294
-
295
-
296
-
297
-
298
-
299
-
300
-
301
-
302
-
303
-
304
-
305
-
306
-
307
-
308
-
309
-
310
-
311
-
312
-
313
-
314
-
315
-
316
-
317
-
318
-
319
-
320
-
321
-
322
-
323
-
324
-
325
-
326
-
327
-
328
-
329
-
330
-
331
-
332
-
333
-
334
-
335
-
336
-
337
-
338
-
339
-
340
-
341
-
342
-
343
-
344
-
345
-
346
-
347
-
348
-
349
-
350
-
351
-
352
-
353
-
354
-
355
-
356
-
357
-
358
-
359
-
360
-
361
-
362
-
363
-
364
-
365
-
366
-
367
-
368
-
369
-
370
-
371
-
372
-
373
-
374
-
375
-
376
-
377
-
378
-
379
-
380
-
381
-
382
-
383
-
384
-
385
-
386
-
387
-
388
-
389
-
390
-
391
-
392
-
393
-
394
-
395
-
396
-
397
-
398
-
399
-
400
-
401
-
402
-
403
-
404
-
405
-
406
-
407
-
408
-
409
-
410
-
411
-
412
-
413
-
414
-
415
-
416
-
417
-
418
-
419
-
420
-
421
-
422
-
423
-
424
 |
 |

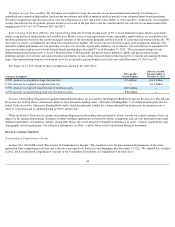
Results of Operations - 2011 Compared to 2010
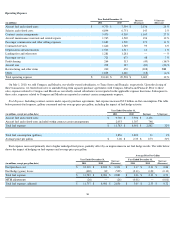
Operating Revenue
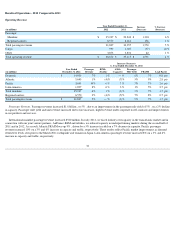
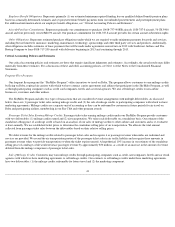
Mainline Passenger Revenue. Mainline passenger revenue increased primarily due to an improvement in the passenger mile yield from fare
increases implemented in response to higher fuel prices and from higher revenue under corporate travel contracts.
Regional carriers . Passenger revenue from regional carriers increased 9% due to an 12% improvement in PRASM on a 2% decline in capacity.
Passenger mile yield increased 12% , reflecting fare increases we implemented in response to increased fuel prices.
Cargo . Cargo revenue increased 21% due to a 12% improvement in yield and an 8% increase in volume.
Other. Other revenue increased $210 million due to higher maintenance sales to third parties by our MRO services business and $65 million due
to an increase in the volume of ticket change fees. These increases were partially offset by $90 million in lower baggage fee revenue, resulting from
an increase in bag fees waived for premium customers and customers under our co-brand credit card agreement with American Express.
35
Year Ended December 31,
Increase % Increase (in millions) 2011 2010
Passenger:
Mainline
$
23,843
$
21,408
$
2,435
11
%
Regional carriers
6,414
5,850
564
10
%
Total passenger revenue
30,257
27,258
2,999
11
%
Cargo
1,027
850
177
21
%
Other
3,831
3,647
184
5
%
Total operating revenue
$
35,115
$
31,755
$
3,360
11
%
Increase (Decrease)
vs. Year Ended December 31, 2010
(in millions) Year Ended
December 31, 2011 Passenger
Revenue RPMs
(Traffic) ASMs
(Capacity) Passenger
Mile Yield PRASM Load Factor
Domestic
$
13,175
11
%
—
%
(
1
)%
11
%
11
%
0.4
pts
Atlantic
5,578
9
%
(1
)%
2
%
10
%
7
%
(2.1
)
pts
Pacific
3,326
20
%
4
%
10
%
15
%
9
%
(4.7
)
pts
Latin America
1,764
13
%
—
%
—
%
13
%
13
%
(0.6
)
pts
Total mainline
23,843
11
%
—
%
1
%
11
%
10
%
(1.0
)
pts
Regional carriers
6,414
9
%
(2
)%
(2
)%
12
%
12
%
0.1
pts
Total passenger revenue
$
30,257
11
%
—
%
1
%
11
%
10
%
(0.9
)
pts
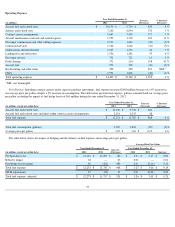
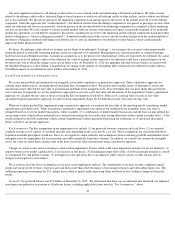
•
Domestic
. Domestic mainline passenger revenue increased 11% due to an 11% improvement in PRASM on a 1% decline in capacity. The
improvement in PRASM reflects higher passenger mile yield driven by fare increases.
•
International
. International mainline passenger revenue increased 13% due to a 9% improvement in PRASM on a 4% capacity increase.
Passenger mile yield increased 12%, reflecting increased business and leisure travel and increased fares, including fuel surcharges. Atlantic
passenger revenue increased 9% due to a 7% increase in PRASM. We and the industry faced overcapacity in the Atlantic, particularly in early
2011, which prevented us from increasing ticket prices sufficiently to cover higher fuel prices. Pacific passenger revenue increased 20% on a
10% capacity increase. Pacific passenger mile yield increased 15% due to a stronger revenue environment, partially offset by the negative
impact from the March 2011 earthquake and tsunami in Japan. Latin America passenger revenue increased 13% , benefiting from a 13%
higher passenger mile yield driven by fare increases.