Delta Airlines 2012 Annual Report Download - page 397
Download and view the complete annual report
Please find page 397 of the 2012 Delta Airlines annual report below. You can navigate through the pages in the report by either clicking on the pages listed below, or by using the keyword search tool below to find specific information within the annual report.-
 1
1 -
2
-
3
-
4
-
5
-
6
-
7
-
8
-
9
-
10
-
11
-
12
-
13
-
14
-
15
-
16
-
17
-
18
-
19
-
20
-
21
-
22
-
23
-
24
-
25
-
26
-
27
-
28
-
29
-
30
-
31
-
32
-
33
-
34
-
35
-
36
-
37
-
38
-
39
-
40
-
41
-
42
-
43
-
44
-
45
-
46
-
47
-
48
-
49
-
50
-
51
-
52
-
53
-
54
-
55
-
56
-
57
-
58
-
59
-
60
-
61
-
62
-
63
-
64
-
65
-
66
-
67
-
68
-
69
-
70
-
71
-
72
-
73
-
74
-
75
-
76
-
77
-
78
-
79
-
80
-
81
-
82
-
83
-
84
-
85
-
86
-
87
-
88
-
89
-
90
-
91
-
92
-
93
-
94
-
95
-
96
-
97
-
98
-
99
-
100
-
101
-
102
-
103
-
104
-
105
-
106
-
107
-
108
-
109
-
110
-
111
-
112
-
113
-
114
-
115
-
116
-
117
-
118
-
119
-
120
-
121
-
122
-
123
-
124
-
125
-
126
-
127
-
128
-
129
-
130
-
131
-
132
-
133
-
134
-
135
-
136
-
137
-
138
-
139
-
140
-
141
-
142
-
143
-
144
-
145
-
146
-
147
-
148
-
149
-
150
-
151
-
152
-
153
-
154
-
155
-
156
-
157
-
158
-
159
-
160
-
161
-
162
-
163
-
164
-
165
-
166
-
167
-
168
-
169
-
170
-
171
-
172
-
173
-
174
-
175
-
176
-
177
-
178
-
179
-
180
-
181
-
182
-
183
-
184
-
185
-
186
-
187
-
188
-
189
-
190
-
191
-
192
-
193
-
194
-
195
-
196
-
197
-
198
-
199
-
200
-
201
-
202
-
203
-
204
-
205
-
206
-
207
-
208
-
209
-
210
-
211
-
212
-
213
-
214
-
215
-
216
-
217
-
218
-
219
-
220
-
221
-
222
-
223
-
224
-
225
-
226
-
227
-
228
-
229
-
230
-
231
-
232
-
233
-
234
-
235
-
236
-
237
-
238
-
239
-
240
-
241
-
242
-
243
-
244
-
245
-
246
-
247
-
248
-
249
-
250
-
251
-
252
-
253
-
254
-
255
-
256
-
257
-
258
-
259
-
260
-
261
-
262
-
263
-
264
-
265
-
266
-
267
-
268
-
269
-
270
-
271
-
272
-
273
-
274
-
275
-
276
-
277
-
278
-
279
-
280
-
281
-
282
-
283
-
284
-
285
-
286
-
287
-
288
-
289
-
290
-
291
-
292
-
293
-
294
-
295
-
296
-
297
-
298
-
299
-
300
-
301
-
302
-
303
-
304
-
305
-
306
-
307
-
308
-
309
-
310
-
311
-
312
-
313
-
314
-
315
-
316
-
317
-
318
-
319
-
320
-
321
-
322
-
323
-
324
-
325
-
326
-
327
-
328
-
329
-
330
-
331
-
332
-
333
-
334
-
335
-
336
-
337
-
338
-
339
-
340
-
341
-
342
-
343
-
344
-
345
-
346
-
347
-
348
-
349
-
350
-
351
-
352
-
353
-
354
-
355
-
356
-
357
-
358
-
359
-
360
-
361
-
362
-
363
-
364
-
365
-
366
-
367
-
368
-
369
-
370
-
371
-
372
-
373
-
374
-
375
-
376
-
377
-
378
-
379
-
380
-
381
-
382
-
383
-
384
-
385
-
386
-
 387
387 -
 388
388 -
 389
389 -
 390
390 -
 391
391 -
 392
392 -
 393
393 -
 394
394 -
 395
395 -
 396
396 -
 397
397 -
 398
398 -
 399
399 -
 400
400 -
 401
401 -
 402
402 -
 403
403 -
 404
404 -
 405
405 -
 406
406 -
 407
407 -
408
-
409
-
410
-
411
-
412
-
413
-
414
-
415
-
416
-
417
-
418
-
419
-
420
-
421
-
422
-
423
-
424
 |
 |
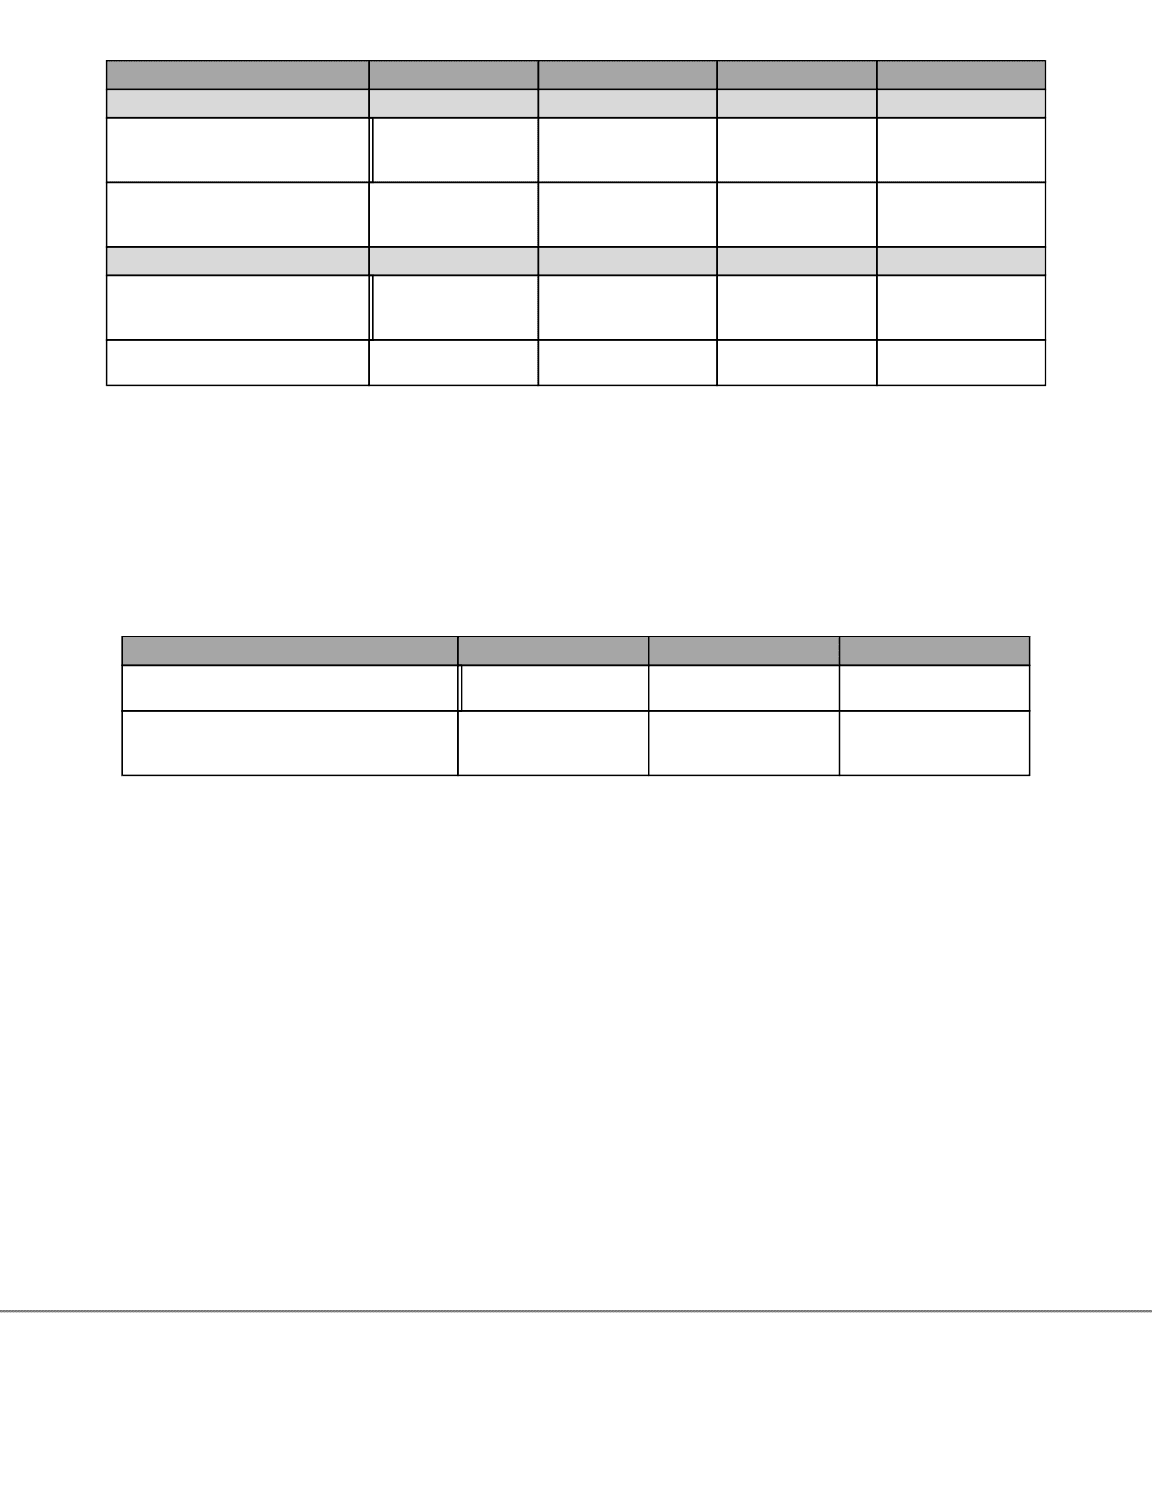
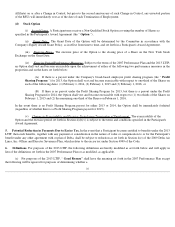
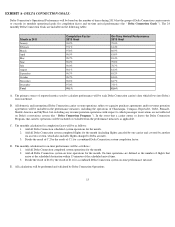
Payouts based on the Shared Rewards Program and Delta Connection Goals will be straight-
line interpolated when actual
performance results fall above Threshold and below Target or above Target and below Maximum.
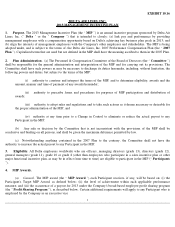
(c) Revenue Performance Measures.
The Revenue Performance measures for 2013 will be measured based on the
comparison of Delta's TRASM for the 2013 calendar year over the 2012 calendar year relative to the Industry Group
Average TRASM for the 2013 calendar year over the 2012 calendar year. The following table describes the performance
ranges and award payout levels for 2013 Revenue Performance, subject to Section 4(c) above:
Payouts based on Revenue Performance will be straight-
line interpolated when actual performance results fall above
Threshold and below Target or above Target and below Maximum; provided, however
, if 2013 Financial Performance
equals or exceeds the Maximum performance level, payouts based on Revenue Performance will not be less than the Target
amount regardless of whether the actual performance results fall below Target.
“ Available Seat Mile ” means the consolidated scheduled and non-
scheduled total number of seats available for
transporting passengers during a reporting period multiplied by the total number of miles flown during that period.
“ Industry Group ”
means Air Tran Holdings, LLC, Alaska Air Group, Inc., AMR Corporation, JetBlue Airways
Corporation, Southwest Airlines Co., United Continental Holdings, Inc., and US Airways Group, Inc.
“ Industry Group Average TRASM ”
means the aggregate Total Operating Revenue for all members of the
Industry Group divided by the aggregate Available Seat Miles of all members of the Industry Group.
“ Total Operating Revenue ”
means, for Delta and each member of the Industry Group, the applicable company's
total operating revenue for a calendar year based on its regularly prepared and publicly available statements of operations
prepared in accordance with accounting principles generally accepted in the United States of America.
5
Below Threshold Threshold Target Maximum
Shared Rewards Program
% of Target Payout for this
Performance Measure (75%
Weighting) 0% 37.5% 75% 150%
Number of monthly Shared Rewards
Program goals actually met during
2013 15 or less 16 21 26 or more
Delta Connection Goals
% of Target Payout for this
Performance Measure (25%
Weighting) 0% 12.5% 25% 50%
Number of Delta Connection Goals
actually met during 2013 8 or less 9 14 19 or more
Threshold Target Maximum
% of Target Revenue Performance Measure
Paid 50% 100% 200%
Delta's 2013 TRASM over 2012 TRASM
relative to Industry Group Average TRASM
for the same period 2012 TRASM
2012 TRASM + 0.50%
points
2012 TRASM + 1.0%
points or more