Delta Airlines 2012 Annual Report Download - page 410
Download and view the complete annual report
Please find page 410 of the 2012 Delta Airlines annual report below. You can navigate through the pages in the report by either clicking on the pages listed below, or by using the keyword search tool below to find specific information within the annual report.-
 1
1 -
2
-
3
-
4
-
5
-
6
-
7
-
8
-
9
-
10
-
11
-
12
-
13
-
14
-
15
-
16
-
17
-
18
-
19
-
20
-
21
-
22
-
23
-
24
-
25
-
26
-
27
-
28
-
29
-
30
-
31
-
32
-
33
-
34
-
35
-
36
-
37
-
38
-
39
-
40
-
41
-
42
-
43
-
44
-
45
-
46
-
47
-
48
-
49
-
50
-
51
-
52
-
53
-
54
-
55
-
56
-
57
-
58
-
59
-
60
-
61
-
62
-
63
-
64
-
65
-
66
-
67
-
68
-
69
-
70
-
71
-
72
-
73
-
74
-
75
-
76
-
77
-
78
-
79
-
80
-
81
-
82
-
83
-
84
-
85
-
86
-
87
-
88
-
89
-
90
-
91
-
92
-
93
-
94
-
95
-
96
-
97
-
98
-
99
-
100
-
101
-
102
-
103
-
104
-
105
-
106
-
107
-
108
-
109
-
110
-
111
-
112
-
113
-
114
-
115
-
116
-
117
-
118
-
119
-
120
-
121
-
122
-
123
-
124
-
125
-
126
-
127
-
128
-
129
-
130
-
131
-
132
-
133
-
134
-
135
-
136
-
137
-
138
-
139
-
140
-
141
-
142
-
143
-
144
-
145
-
146
-
147
-
148
-
149
-
150
-
151
-
152
-
153
-
154
-
155
-
156
-
157
-
158
-
159
-
160
-
161
-
162
-
163
-
164
-
165
-
166
-
167
-
168
-
169
-
170
-
171
-
172
-
173
-
174
-
175
-
176
-
177
-
178
-
179
-
180
-
181
-
182
-
183
-
184
-
185
-
186
-
187
-
188
-
189
-
190
-
191
-
192
-
193
-
194
-
195
-
196
-
197
-
198
-
199
-
200
-
201
-
202
-
203
-
204
-
205
-
206
-
207
-
208
-
209
-
210
-
211
-
212
-
213
-
214
-
215
-
216
-
217
-
218
-
219
-
220
-
221
-
222
-
223
-
224
-
225
-
226
-
227
-
228
-
229
-
230
-
231
-
232
-
233
-
234
-
235
-
236
-
237
-
238
-
239
-
240
-
241
-
242
-
243
-
244
-
245
-
246
-
247
-
248
-
249
-
250
-
251
-
252
-
253
-
254
-
255
-
256
-
257
-
258
-
259
-
260
-
261
-
262
-
263
-
264
-
265
-
266
-
267
-
268
-
269
-
270
-
271
-
272
-
273
-
274
-
275
-
276
-
277
-
278
-
279
-
280
-
281
-
282
-
283
-
284
-
285
-
286
-
287
-
288
-
289
-
290
-
291
-
292
-
293
-
294
-
295
-
296
-
297
-
298
-
299
-
300
-
301
-
302
-
303
-
304
-
305
-
306
-
307
-
308
-
309
-
310
-
311
-
312
-
313
-
314
-
315
-
316
-
317
-
318
-
319
-
320
-
321
-
322
-
323
-
324
-
325
-
326
-
327
-
328
-
329
-
330
-
331
-
332
-
333
-
334
-
335
-
336
-
337
-
338
-
339
-
340
-
341
-
342
-
343
-
344
-
345
-
346
-
347
-
348
-
349
-
350
-
351
-
352
-
353
-
354
-
355
-
356
-
357
-
358
-
359
-
360
-
361
-
362
-
363
-
364
-
365
-
366
-
367
-
368
-
369
-
370
-
371
-
372
-
373
-
374
-
375
-
376
-
377
-
378
-
379
-
380
-
381
-
382
-
383
-
384
-
385
-
386
-
387
-
388
-
389
-
390
-
391
-
392
-
393
-
394
-
395
-
396
-
397
-
398
-
399
-
 400
400 -
 401
401 -
 402
402 -
 403
403 -
 404
404 -
 405
405 -
 406
406 -
 407
407 -
 408
408 -
 409
409 -
 410
410 -
 411
411 -
 412
412 -
 413
413 -
 414
414 -
 415
415 -
 416
416 -
 417
417 -
 418
418 -
 419
419 -
 420
420 -
421
-
422
-
423
-
424
 |
 |

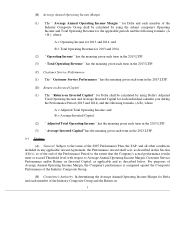
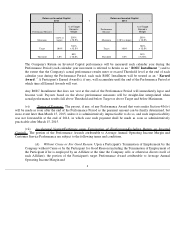
(B) Average Annual Operating Income Margin .
A = Operating Income for 2013 and 2014; and
B = Total Operating Revenue for 2013 and 2014.
(C) Customer Service Performance .
(D) Return on Invested Capital .
A = Adjusted Total Operating Income; and
B = Average Invested Capital.
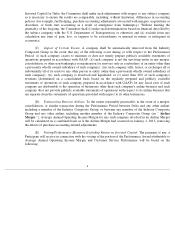
(v) Vesting .
(A) General.
Subject to the terms of the 2007 Performance Plan, the TAP, and all other conditions
included in any applicable Award Agreement, the Performance Award shall vest, as described in this Section
4(b)(v), as of the end of the Performance Period to the extent that the Company's actual performance results
meet or exceed Threshold level with respect to Average Annual Operating Income Margin, Customer Service
Performance and/or Return on Invested Capital, as applicable and as described below. For purposes of
Average Annual Operating Income Margin, the Company's performance is compared against the Composite
Performance of the Industry Composite Group.
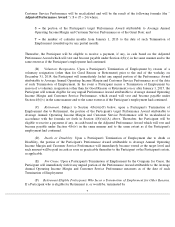
(B) Committee's Authority.
In determining the Average Annual Operating Income Margin for Delta
and each member of the Industry Composite Group and the Return on
5
(1) The “ Average Annual Operating Income Margin ”
for Delta and each member of the
Industry Composite Group shall be calculated by using the subject company's Operating
Income and Total Operating Revenue for the applicable periods and the following formula: (A
÷ B ), where:
(2) “ Operating Income ”
has the meaning given such term in the 2013 LTIP.
(3) “ Total Operating Revenue ”
has the meaning given such term in the 2013 LTIP.
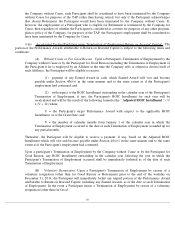
(1) The “ Customer Service Performance ”
has the meaning given such term in the 2013 LTIP.
(1) The “ Return on Invested Capital ”
for Delta shall be calculated by using Delta's Adjusted
Total Operating Income and Average Invested Capital for each individual calendar year during
the Performance Period (2013 and 2014) and the following formula, (A B), where:
(2) “
Adjusted
Total Operating Income
”
has the meaning given such term in the 2013 LTIP.
(3) “
Average Invested Capital
”
has the meaning given such term in the 2013 LTIP.