Delta Airlines 2012 Annual Report Download - page 92
Download and view the complete annual report
Please find page 92 of the 2012 Delta Airlines annual report below. You can navigate through the pages in the report by either clicking on the pages listed below, or by using the keyword search tool below to find specific information within the annual report.-
 1
1 -
2
-
3
-
4
-
5
-
6
-
7
-
8
-
9
-
10
-
11
-
12
-
13
-
14
-
15
-
16
-
17
-
18
-
19
-
20
-
21
-
22
-
23
-
24
-
25
-
26
-
27
-
28
-
29
-
30
-
31
-
32
-
33
-
34
-
35
-
36
-
37
-
38
-
39
-
40
-
41
-
42
-
43
-
44
-
45
-
46
-
47
-
48
-
49
-
50
-
51
-
52
-
53
-
54
-
55
-
56
-
57
-
58
-
59
-
60
-
61
-
62
-
63
-
64
-
65
-
66
-
67
-
68
-
69
-
70
-
71
-
72
-
73
-
74
-
75
-
76
-
77
-
78
-
79
-
80
-
81
-
 82
82 -
 83
83 -
 84
84 -
 85
85 -
 86
86 -
 87
87 -
 88
88 -
 89
89 -
 90
90 -
 91
91 -
 92
92 -
 93
93 -
 94
94 -
 95
95 -
 96
96 -
 97
97 -
 98
98 -
 99
99 -
 100
100 -
 101
101 -
 102
102 -
103
-
104
-
105
-
106
-
107
-
108
-
109
-
110
-
111
-
112
-
113
-
114
-
115
-
116
-
117
-
118
-
119
-
120
-
121
-
122
-
123
-
124
-
125
-
126
-
127
-
128
-
129
-
130
-
131
-
132
-
133
-
134
-
135
-
136
-
137
-
138
-
139
-
140
-
141
-
142
-
143
-
144
-
145
-
146
-
147
-
148
-
149
-
150
-
151
-
152
-
153
-
154
-
155
-
156
-
157
-
158
-
159
-
160
-
161
-
162
-
163
-
164
-
165
-
166
-
167
-
168
-
169
-
170
-
171
-
172
-
173
-
174
-
175
-
176
-
177
-
178
-
179
-
180
-
181
-
182
-
183
-
184
-
185
-
186
-
187
-
188
-
189
-
190
-
191
-
192
-
193
-
194
-
195
-
196
-
197
-
198
-
199
-
200
-
201
-
202
-
203
-
204
-
205
-
206
-
207
-
208
-
209
-
210
-
211
-
212
-
213
-
214
-
215
-
216
-
217
-
218
-
219
-
220
-
221
-
222
-
223
-
224
-
225
-
226
-
227
-
228
-
229
-
230
-
231
-
232
-
233
-
234
-
235
-
236
-
237
-
238
-
239
-
240
-
241
-
242
-
243
-
244
-
245
-
246
-
247
-
248
-
249
-
250
-
251
-
252
-
253
-
254
-
255
-
256
-
257
-
258
-
259
-
260
-
261
-
262
-
263
-
264
-
265
-
266
-
267
-
268
-
269
-
270
-
271
-
272
-
273
-
274
-
275
-
276
-
277
-
278
-
279
-
280
-
281
-
282
-
283
-
284
-
285
-
286
-
287
-
288
-
289
-
290
-
291
-
292
-
293
-
294
-
295
-
296
-
297
-
298
-
299
-
300
-
301
-
302
-
303
-
304
-
305
-
306
-
307
-
308
-
309
-
310
-
311
-
312
-
313
-
314
-
315
-
316
-
317
-
318
-
319
-
320
-
321
-
322
-
323
-
324
-
325
-
326
-
327
-
328
-
329
-
330
-
331
-
332
-
333
-
334
-
335
-
336
-
337
-
338
-
339
-
340
-
341
-
342
-
343
-
344
-
345
-
346
-
347
-
348
-
349
-
350
-
351
-
352
-
353
-
354
-
355
-
356
-
357
-
358
-
359
-
360
-
361
-
362
-
363
-
364
-
365
-
366
-
367
-
368
-
369
-
370
-
371
-
372
-
373
-
374
-
375
-
376
-
377
-
378
-
379
-
380
-
381
-
382
-
383
-
384
-
385
-
386
-
387
-
388
-
389
-
390
-
391
-
392
-
393
-
394
-
395
-
396
-
397
-
398
-
399
-
400
-
401
-
402
-
403
-
404
-
405
-
406
-
407
-
408
-
409
-
410
-
411
-
412
-
413
-
414
-
415
-
416
-
417
-
418
-
419
-
420
-
421
-
422
-
423
-
424
 |
 |

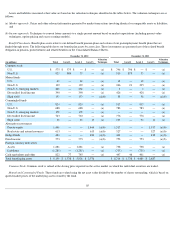
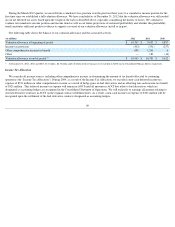
Assets and liabilities measured at fair value are based on the valuation techniques identified in the tables below. The valuation techniques are as
follows:
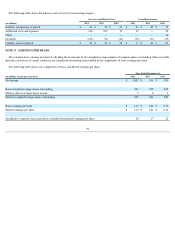
Benefit Plan Assets. Benefit plan assets relate to our defined benefit pension plans and certain of our postemployment benefit plans that are
funded through trusts. The following table shows our benefit plan assets by asset class. These investments are presented net of the related benefit
obligation in pension, postretirement and related benefits on the Consolidated Balance Sheets.
Common Stock. Common stock is valued at the closing price reported on the active market on which the individual securities are traded.
Mutual and Commingled Funds. These funds are valued using the net asset value divided by the number of shares outstanding, which is based on
quoted market prices of the underlying assets owned by the fund.
85
(a)
Market approach
. Prices and other relevant information generated by market transactions involving identical or comparable assets or liabilities;
and
(b)
Income approach.
Techniques to convert future amounts to a single present amount based on market expectations (including present value
techniques, option-pricing and excess earnings models).
December 31, 2012
December 31, 2011
(in millions) Total Level 1 Level 2 Level 3 Valuation
Technique
Total Level 1 Level 2 Level 3 Valuation
Technique
Common stock
U.S.
$
575
$
575
$
—
$
—
(a)
$
796
$
796
$
—
$
—
(a)
Non-U.S.
923
886
37
—
(a)
910
875
35
—
(a)
Mutual funds
U.S.
69
—
69
—
(a)
18
—
18
—
(a)
Non-U.S.
129
—
129
—
(a)
246
21
225
—
(a)
Non-U.S. emerging markets
466
—
466
—
(a)
2
—
2
—
(a)
Diversified fixed income
390
—
390
—
(a)
426
—
426
—
(a)
High yield
153
—
153
—
(a)(b)
58
—
58
—
(a)(b)
Commingled funds
U.S.
824
—
824
—
(a)
917
—
917
—
(a)
Non-U.S.
688
—
688
—
(a)
783
—
783
—
(a)
Non-U.S. emerging markets
178
—
178
—
(a)
—
—
—
—
(a)
Diversified fixed income
763
—
763
—
(a)
776
—
776
—
(a)
High yield
38
—
25
13
(a)
103
—
92
11
(a)
Alternative investments
Private equity
1,466
—
—
1,466
(a)(b)
1,517
—
—
1,517
(a)(b)
Real estate and natural resources
613
—
—
613
(a)(b)
527
—
—
527
(a)(b)
Hedge Funds
484
—
—
484
(a)(b)
432
—
—
432
(a)(b)
Fixed income
573
—
573
—
(a)(b)
753
—
753
—
(a)(b)
Foreign currency derivatives
Assets
1,281
—
1,281
—
(a)
738
—
738
—
(a)
Liabilities
(1,285
)
—
(
1,285
)
—
(a)
(735
)
—
(
735
)
—
(a)
Cash equivalents and other
822
77
745
—
(a)
447
46
401
—
(a)
Total benefit plan assets
$
9,150
$
1,538
$
5,036
$
2,576
$
8,714
$
1,738
$
4,489
$
2,487