Delta Airlines 2012 Annual Report Download - page 64
Download and view the complete annual report
Please find page 64 of the 2012 Delta Airlines annual report below. You can navigate through the pages in the report by either clicking on the pages listed below, or by using the keyword search tool below to find specific information within the annual report.-
 1
1 -
2
-
3
-
4
-
5
-
6
-
7
-
8
-
9
-
10
-
11
-
12
-
13
-
14
-
15
-
16
-
17
-
18
-
19
-
20
-
21
-
22
-
23
-
24
-
25
-
26
-
27
-
28
-
29
-
30
-
31
-
32
-
33
-
34
-
35
-
36
-
37
-
38
-
39
-
40
-
41
-
42
-
43
-
44
-
45
-
46
-
47
-
48
-
49
-
50
-
51
-
52
-
53
-
 54
54 -
 55
55 -
 56
56 -
 57
57 -
 58
58 -
 59
59 -
 60
60 -
 61
61 -
 62
62 -
 63
63 -
 64
64 -
 65
65 -
 66
66 -
 67
67 -
 68
68 -
 69
69 -
 70
70 -
 71
71 -
 72
72 -
 73
73 -
 74
74 -
75
-
76
-
77
-
78
-
79
-
80
-
81
-
82
-
83
-
84
-
85
-
86
-
87
-
88
-
89
-
90
-
91
-
92
-
93
-
94
-
95
-
96
-
97
-
98
-
99
-
100
-
101
-
102
-
103
-
104
-
105
-
106
-
107
-
108
-
109
-
110
-
111
-
112
-
113
-
114
-
115
-
116
-
117
-
118
-
119
-
120
-
121
-
122
-
123
-
124
-
125
-
126
-
127
-
128
-
129
-
130
-
131
-
132
-
133
-
134
-
135
-
136
-
137
-
138
-
139
-
140
-
141
-
142
-
143
-
144
-
145
-
146
-
147
-
148
-
149
-
150
-
151
-
152
-
153
-
154
-
155
-
156
-
157
-
158
-
159
-
160
-
161
-
162
-
163
-
164
-
165
-
166
-
167
-
168
-
169
-
170
-
171
-
172
-
173
-
174
-
175
-
176
-
177
-
178
-
179
-
180
-
181
-
182
-
183
-
184
-
185
-
186
-
187
-
188
-
189
-
190
-
191
-
192
-
193
-
194
-
195
-
196
-
197
-
198
-
199
-
200
-
201
-
202
-
203
-
204
-
205
-
206
-
207
-
208
-
209
-
210
-
211
-
212
-
213
-
214
-
215
-
216
-
217
-
218
-
219
-
220
-
221
-
222
-
223
-
224
-
225
-
226
-
227
-
228
-
229
-
230
-
231
-
232
-
233
-
234
-
235
-
236
-
237
-
238
-
239
-
240
-
241
-
242
-
243
-
244
-
245
-
246
-
247
-
248
-
249
-
250
-
251
-
252
-
253
-
254
-
255
-
256
-
257
-
258
-
259
-
260
-
261
-
262
-
263
-
264
-
265
-
266
-
267
-
268
-
269
-
270
-
271
-
272
-
273
-
274
-
275
-
276
-
277
-
278
-
279
-
280
-
281
-
282
-
283
-
284
-
285
-
286
-
287
-
288
-
289
-
290
-
291
-
292
-
293
-
294
-
295
-
296
-
297
-
298
-
299
-
300
-
301
-
302
-
303
-
304
-
305
-
306
-
307
-
308
-
309
-
310
-
311
-
312
-
313
-
314
-
315
-
316
-
317
-
318
-
319
-
320
-
321
-
322
-
323
-
324
-
325
-
326
-
327
-
328
-
329
-
330
-
331
-
332
-
333
-
334
-
335
-
336
-
337
-
338
-
339
-
340
-
341
-
342
-
343
-
344
-
345
-
346
-
347
-
348
-
349
-
350
-
351
-
352
-
353
-
354
-
355
-
356
-
357
-
358
-
359
-
360
-
361
-
362
-
363
-
364
-
365
-
366
-
367
-
368
-
369
-
370
-
371
-
372
-
373
-
374
-
375
-
376
-
377
-
378
-
379
-
380
-
381
-
382
-
383
-
384
-
385
-
386
-
387
-
388
-
389
-
390
-
391
-
392
-
393
-
394
-
395
-
396
-
397
-
398
-
399
-
400
-
401
-
402
-
403
-
404
-
405
-
406
-
407
-
408
-
409
-
410
-
411
-
412
-
413
-
414
-
415
-
416
-
417
-
418
-
419
-
420
-
421
-
422
-
423
-
424
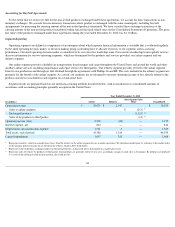
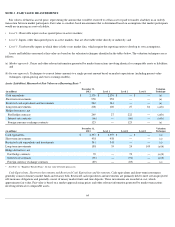
 |
 |

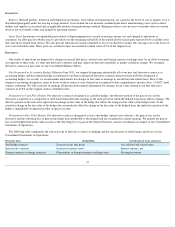
Inventories
Refinery.
Refined product, feedstock and blendstock inventories, all of which are finished goods, are carried at the lower of cost or market. Cost is
determined principally under the moving average method. Costs include the raw material consumed plus direct manufacturing costs (such as labor,
utilities and supplies) as incurred and an applicable portion of manufacturing overhead. Ending inventory costs in excess of market value are written
down to net recoverable values and charged to operating expense.
Spare Parts. Inventories of expendable parts related to flight equipment are carried at moving average cost and charged to operations as
consumed. An allowance for obsolescence is provided over the remaining useful life of the related fleet for spare parts expected to be available at the
date aircraft are retired from service. We also provide allowances for parts identified as excess or obsolete to reduce the carrying costs to the lower of
cost or net realizable value. These parts are assumed to have an estimated residual value of 5% of the original cost.
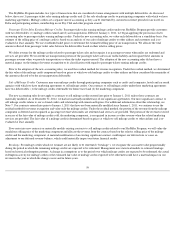
Derivatives
Our results of operations are impacted by changes in aircraft fuel prices, interest rates and foreign currency exchange rates. In an effort to manage
our exposure to these risks, we enter into derivative contracts and may adjust our derivative portfolio as market conditions change. We recognize
derivative contracts at fair value on our Consolidated Balance Sheets.
Not Designated as Accounting Hedges. Effective June 2011, we stopped designating substantially all of our new fuel derivative contracts as
accounting hedges and discontinued hedge accounting for our then existing fuel derivative contracts that previously had been designated as
accounting hedges. As a result, we record market adjustments for changes in fair value to earnings in aircraft fuel and related taxes. Prior to this
change in accounting designation, gains or losses on these contracts were deferred in accumulated other comprehensive income (loss) ("AOCI") until
contract settlement. We will reclassify to earnings all amounts from market adjustments for changes in fair value relating to our fuel derivative
contracts in AOCI on the original contract settlement dates.
Designated as Cash Flow Hedges. For derivative contracts designated as cash flow hedges, the effective portion of the gain or loss on the
derivative is reported as a component of AOCI and reclassified into earnings in the same period in which the hedged transaction affects earnings. The
effective portion of the derivative represents the change in fair value of the hedge that offsets the change in fair value of the hedged item. To the
extent the change in the fair value of the hedge does not perfectly offset the change in the fair value of the hedged item, the ineffective portion of the
hedge is immediately recognized in other (expense) income.
Designated as Fair Value Hedges. For derivative contracts designated as fair value hedges (interest rate contracts), the gain or loss on the
derivative and the offsetting loss or gain on the hedge item attributable to the hedged risk are recognized in current earnings. We include the gain or
loss on the hedged item in the same account as the offsetting loss or gain on the related derivative contract, resulting in no impact to our Consolidated
Statements of Operations.
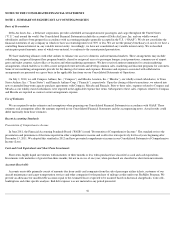
The following table summarizes the risk each type of derivative contract is hedging and the classification of related gains and losses on our
Consolidated Statements of Operations:
57
Derivative Type Hedged Risk Classification of Gains and Losses
Fuel hedge contracts Increases in jet fuel prices Aircraft fuel and related taxes
Interest rate contracts Increases in interest rates Interest expense, net
Foreign currency exchange contracts Fluctuations in foreign currency exchange rates Passenger revenue