Delta Airlines 2012 Annual Report Download - page 41
Download and view the complete annual report
Please find page 41 of the 2012 Delta Airlines annual report below. You can navigate through the pages in the report by either clicking on the pages listed below, or by using the keyword search tool below to find specific information within the annual report.-
 1
1 -
2
-
3
-
4
-
5
-
6
-
7
-
8
-
9
-
10
-
11
-
12
-
13
-
14
-
15
-
16
-
17
-
18
-
19
-
20
-
21
-
22
-
23
-
24
-
25
-
26
-
27
-
28
-
29
-
30
-
 31
31 -
 32
32 -
 33
33 -
 34
34 -
 35
35 -
 36
36 -
 37
37 -
 38
38 -
 39
39 -
 40
40 -
 41
41 -
 42
42 -
 43
43 -
 44
44 -
 45
45 -
 46
46 -
 47
47 -
 48
48 -
 49
49 -
 50
50 -
 51
51 -
52
-
53
-
54
-
55
-
56
-
57
-
58
-
59
-
60
-
61
-
62
-
63
-
64
-
65
-
66
-
67
-
68
-
69
-
70
-
71
-
72
-
73
-
74
-
75
-
76
-
77
-
78
-
79
-
80
-
81
-
82
-
83
-
84
-
85
-
86
-
87
-
88
-
89
-
90
-
91
-
92
-
93
-
94
-
95
-
96
-
97
-
98
-
99
-
100
-
101
-
102
-
103
-
104
-
105
-
106
-
107
-
108
-
109
-
110
-
111
-
112
-
113
-
114
-
115
-
116
-
117
-
118
-
119
-
120
-
121
-
122
-
123
-
124
-
125
-
126
-
127
-
128
-
129
-
130
-
131
-
132
-
133
-
134
-
135
-
136
-
137
-
138
-
139
-
140
-
141
-
142
-
143
-
144
-
145
-
146
-
147
-
148
-
149
-
150
-
151
-
152
-
153
-
154
-
155
-
156
-
157
-
158
-
159
-
160
-
161
-
162
-
163
-
164
-
165
-
166
-
167
-
168
-
169
-
170
-
171
-
172
-
173
-
174
-
175
-
176
-
177
-
178
-
179
-
180
-
181
-
182
-
183
-
184
-
185
-
186
-
187
-
188
-
189
-
190
-
191
-
192
-
193
-
194
-
195
-
196
-
197
-
198
-
199
-
200
-
201
-
202
-
203
-
204
-
205
-
206
-
207
-
208
-
209
-
210
-
211
-
212
-
213
-
214
-
215
-
216
-
217
-
218
-
219
-
220
-
221
-
222
-
223
-
224
-
225
-
226
-
227
-
228
-
229
-
230
-
231
-
232
-
233
-
234
-
235
-
236
-
237
-
238
-
239
-
240
-
241
-
242
-
243
-
244
-
245
-
246
-
247
-
248
-
249
-
250
-
251
-
252
-
253
-
254
-
255
-
256
-
257
-
258
-
259
-
260
-
261
-
262
-
263
-
264
-
265
-
266
-
267
-
268
-
269
-
270
-
271
-
272
-
273
-
274
-
275
-
276
-
277
-
278
-
279
-
280
-
281
-
282
-
283
-
284
-
285
-
286
-
287
-
288
-
289
-
290
-
291
-
292
-
293
-
294
-
295
-
296
-
297
-
298
-
299
-
300
-
301
-
302
-
303
-
304
-
305
-
306
-
307
-
308
-
309
-
310
-
311
-
312
-
313
-
314
-
315
-
316
-
317
-
318
-
319
-
320
-
321
-
322
-
323
-
324
-
325
-
326
-
327
-
328
-
329
-
330
-
331
-
332
-
333
-
334
-
335
-
336
-
337
-
338
-
339
-
340
-
341
-
342
-
343
-
344
-
345
-
346
-
347
-
348
-
349
-
350
-
351
-
352
-
353
-
354
-
355
-
356
-
357
-
358
-
359
-
360
-
361
-
362
-
363
-
364
-
365
-
366
-
367
-
368
-
369
-
370
-
371
-
372
-
373
-
374
-
375
-
376
-
377
-
378
-
379
-
380
-
381
-
382
-
383
-
384
-
385
-
386
-
387
-
388
-
389
-
390
-
391
-
392
-
393
-
394
-
395
-
396
-
397
-
398
-
399
-
400
-
401
-
402
-
403
-
404
-
405
-
406
-
407
-
408
-
409
-
410
-
411
-
412
-
413
-
414
-
415
-
416
-
417
-
418
-
419
-
420
-
421
-
422
-
423
-
424
 |
 |

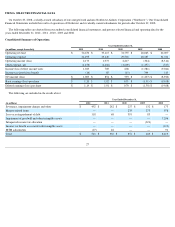
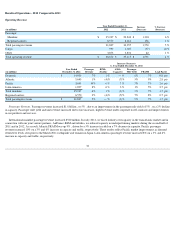
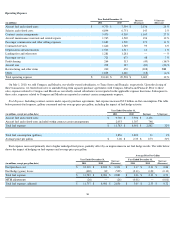
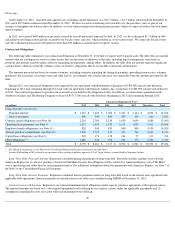
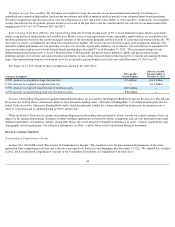
Operating Expense
On July 1, 2010, we sold Compass and Mesaba, our wholly-owned subsidiaries, to Trans States and Pinnacle, respectively. Upon the closing of
these transactions, we entered into new or amended long-term capacity purchase agreements with Compass, Mesaba and Pinnacle. Prior to these
sales, expenses related to Compass and Mesaba as our wholly-owned subsidiaries were reported in the applicable expense line items. Subsequent to
these sales, expenses related to Compass and Mesaba are reported as contract carrier arrangements expense.
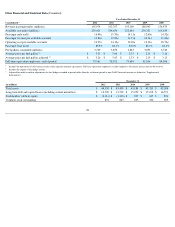
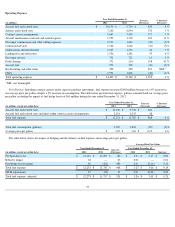
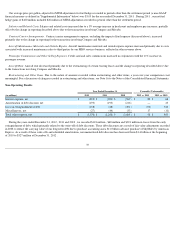
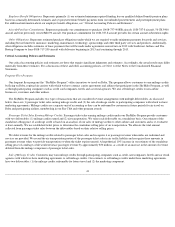
Fuel Expense. Including contract carriers under capacity purchase agreements, fuel expense increased $2.9 billion on flat consumption. The table
below presents fuel expense, gallons consumed and our average price per gallon, including the impact of fuel hedge activity:
Fuel expense increased primarily due to higher unhedged fuel prices, partially offset by an improvement in net fuel hedge results. The table below
shows the impact of hedging on fuel expense and average price per gallon:
36
Year Ended December 31, Increase
(Decrease) % Increase
(Decrease) (in millions) 2011 2010
Aircraft fuel and related taxes
$
9,730
$
7,594
$
2,136
28
%
Salaries and related costs
6,894
6,751
143
2
%
Contract carrier arrangements
5,470
4,305
1,165
27
%
Aircraft maintenance materials and outside repairs
1,765
1,569
196
12
%
Passenger commissions and other selling expenses
1,682
1,509
173
11
%
Contracted services
1,642
1,549
93
6
%
Depreciation and amortization
1,523
1,511
12
1
%
Landing fees and other rents
1,281
1,281
—
—
%
Passenger service
721
673
48
7
%
Profit sharing
264
313
(49
)
(16
)%
Aircraft rent
298
387
(89
)
(23
)%
Restructuring and other items
242
450
(208
)
NM
Other
1,628
1,646
(18
)
(1
)%
Total operating expense
$
33,140
$
29,538
$
3,602
12
%
Year Ended December 31,
Increase % Increase (in millions, except per gallon data) 2011 2010
Aircraft fuel and related taxes
$
9,730
$
7,594
$
2,136
Aircraft fuel and related taxes included within contract carrier arrangements
2,053
1,307
746
Total fuel expense
$
11,783
$
8,901
$
2,882
32
%
Total fuel consumption (gallons)
3,856
3,823
33
1
%
Average price per gallon
$
3.06
$
2.33
$
0.73
31
%
Average Price Per Gallon
Year Ended December 31, Increase
(Decrease)
Year Ended December 31, Increase
(Decrease) (in millions, except per gallon data) 2011 2010
2011 2010
Fuel purchase cost
$
12,203
$
8,812
$
3,391
$
3.17
$
2.31
$
0.86
Fuel hedge (gains) losses
(420
)
89
(509
)
(0.11
)
0.02
(0.13
)
Total fuel expense
$
11,783
$
8,901
$
2,882
$
3.06
$
2.33
$
0.73
MTM adjustments
(26
)
—
(
26
)
(0.01
)
—
(
0.01
)
Total fuel expense, adjusted
$
11,757
$
8,901
$
2,856
$
3.05
$
2.33
$
0.72