Delta Airlines 2012 Annual Report Download - page 90
Download and view the complete annual report
Please find page 90 of the 2012 Delta Airlines annual report below. You can navigate through the pages in the report by either clicking on the pages listed below, or by using the keyword search tool below to find specific information within the annual report.-
 1
1 -
2
-
3
-
4
-
5
-
6
-
7
-
8
-
9
-
10
-
11
-
12
-
13
-
14
-
15
-
16
-
17
-
18
-
19
-
20
-
21
-
22
-
23
-
24
-
25
-
26
-
27
-
28
-
29
-
30
-
31
-
32
-
33
-
34
-
35
-
36
-
37
-
38
-
39
-
40
-
41
-
42
-
43
-
44
-
45
-
46
-
47
-
48
-
49
-
50
-
51
-
52
-
53
-
54
-
55
-
56
-
57
-
58
-
59
-
60
-
61
-
62
-
63
-
64
-
65
-
66
-
67
-
68
-
69
-
70
-
71
-
72
-
73
-
74
-
75
-
76
-
77
-
78
-
79
-
 80
80 -
 81
81 -
 82
82 -
 83
83 -
 84
84 -
 85
85 -
 86
86 -
 87
87 -
 88
88 -
 89
89 -
 90
90 -
 91
91 -
 92
92 -
 93
93 -
 94
94 -
 95
95 -
 96
96 -
 97
97 -
 98
98 -
 99
99 -
 100
100 -
101
-
102
-
103
-
104
-
105
-
106
-
107
-
108
-
109
-
110
-
111
-
112
-
113
-
114
-
115
-
116
-
117
-
118
-
119
-
120
-
121
-
122
-
123
-
124
-
125
-
126
-
127
-
128
-
129
-
130
-
131
-
132
-
133
-
134
-
135
-
136
-
137
-
138
-
139
-
140
-
141
-
142
-
143
-
144
-
145
-
146
-
147
-
148
-
149
-
150
-
151
-
152
-
153
-
154
-
155
-
156
-
157
-
158
-
159
-
160
-
161
-
162
-
163
-
164
-
165
-
166
-
167
-
168
-
169
-
170
-
171
-
172
-
173
-
174
-
175
-
176
-
177
-
178
-
179
-
180
-
181
-
182
-
183
-
184
-
185
-
186
-
187
-
188
-
189
-
190
-
191
-
192
-
193
-
194
-
195
-
196
-
197
-
198
-
199
-
200
-
201
-
202
-
203
-
204
-
205
-
206
-
207
-
208
-
209
-
210
-
211
-
212
-
213
-
214
-
215
-
216
-
217
-
218
-
219
-
220
-
221
-
222
-
223
-
224
-
225
-
226
-
227
-
228
-
229
-
230
-
231
-
232
-
233
-
234
-
235
-
236
-
237
-
238
-
239
-
240
-
241
-
242
-
243
-
244
-
245
-
246
-
247
-
248
-
249
-
250
-
251
-
252
-
253
-
254
-
255
-
256
-
257
-
258
-
259
-
260
-
261
-
262
-
263
-
264
-
265
-
266
-
267
-
268
-
269
-
270
-
271
-
272
-
273
-
274
-
275
-
276
-
277
-
278
-
279
-
280
-
281
-
282
-
283
-
284
-
285
-
286
-
287
-
288
-
289
-
290
-
291
-
292
-
293
-
294
-
295
-
296
-
297
-
298
-
299
-
300
-
301
-
302
-
303
-
304
-
305
-
306
-
307
-
308
-
309
-
310
-
311
-
312
-
313
-
314
-
315
-
316
-
317
-
318
-
319
-
320
-
321
-
322
-
323
-
324
-
325
-
326
-
327
-
328
-
329
-
330
-
331
-
332
-
333
-
334
-
335
-
336
-
337
-
338
-
339
-
340
-
341
-
342
-
343
-
344
-
345
-
346
-
347
-
348
-
349
-
350
-
351
-
352
-
353
-
354
-
355
-
356
-
357
-
358
-
359
-
360
-
361
-
362
-
363
-
364
-
365
-
366
-
367
-
368
-
369
-
370
-
371
-
372
-
373
-
374
-
375
-
376
-
377
-
378
-
379
-
380
-
381
-
382
-
383
-
384
-
385
-
386
-
387
-
388
-
389
-
390
-
391
-
392
-
393
-
394
-
395
-
396
-
397
-
398
-
399
-
400
-
401
-
402
-
403
-
404
-
405
-
406
-
407
-
408
-
409
-
410
-
411
-
412
-
413
-
414
-
415
-
416
-
417
-
418
-
419
-
420
-
421
-
422
-
423
-
424
 |
 |

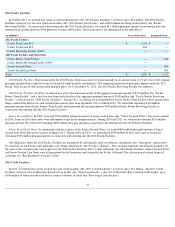
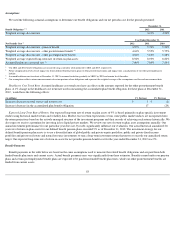
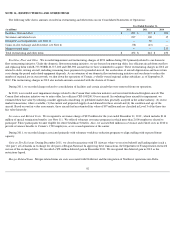
Assumptions
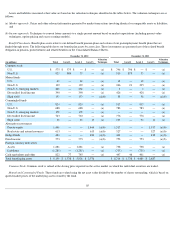
We used the following actuarial assumptions to determine our benefit obligations and our net periodic cost for the periods presented:
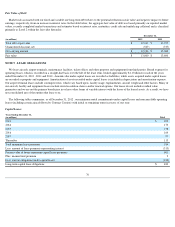
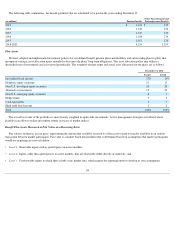
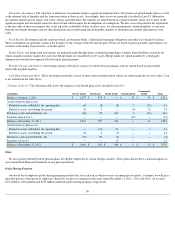
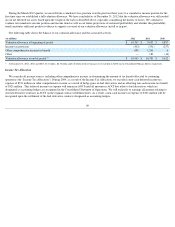
Healthcare Cost Trend Rate. Assumed healthcare cost trend rates have an effect on the amounts reported for the other postretirement benefit
plans. A 1% change in the healthcare cost trend rate used in measuring the accumulated plan benefit obligation for these plans at December 31,
2012 , would have the following effects:
Expected Long-Term Rate of Return. Our expected long-term rate of return on plan assets of 9% is based primarily on plan-specific investment
studies using historical market return and volatility data. Modest excess return expectations versus some public market indices are incorporated into
the return projections based on the actively managed structure of the investment programs and their records of achieving such returns historically. We
also expect to receive a premium for investing in less liquid private markets. We review our rate of return on plan asset assumptions annually. Our
annual investment performance for one particular year does not, by itself, significantly influence our evaluation. Our actual historical annualized 20-
year rate of return on plan assets for our defined benefit pension plans exceeded 9% as of December 31, 2012. The investment strategy for our
defined benefit pension plan assets is to use a diversified mix of global public and private equity portfolios, public and private fixed income
portfolios and private real estate and natural resource investments to earn a long-term investment return that meets or exceeds our annualized return
target. Our expected long-term rate of return on assets for net periodic pension benefit cost for the year ended December 31, 2012 was 9% .
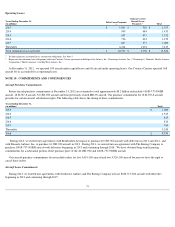
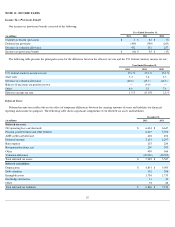
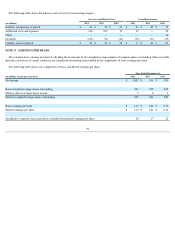
Benefit Payments
Benefit payments in the table below are based on the same assumptions used to measure the related benefit obligations and are paid from both
funded benefit plan trusts and current assets. Actual benefit payments may vary significantly from these estimates. Benefits earned under our pension
plans and certain postemployment benefit plans are expected to be paid from funded benefit plan trusts, while our other postretirement benefits are
funded from current assets.
83
December 31,
Benefit Obligations
(1)(2)
2012 2011
Weighted average discount rate
4.11
%
4.94
%
Year Ended December 31,
Net Periodic Cost
(2)
2012 2011 2010
Weighted average discount rate - pension benefit
4.95
%
5.70
%
5.93
%
Weighted average discount rate - other postretirement benefit
(4)
4.63
%
5.55
%
5.75
%
Weighted average discount rate - other postemployment benefit
4.88
%
5.63
%
5.88
%
Weighted average expected long-term rate of return on plan assets
8.94
%
8.93
%
8.82
%
Assumed healthcare cost trend rate
(3)
7.00
%
7.00
%
7.50
%
(1)
Our 2012 and 2011
benefit obligations are measured using a mortality table projected to 2016 and 2015, respectively.
(2)
Future compensation levels do not impact our frozen defined benefit pension plans or other postretirement plans and impact only a small portion of our other postemployment
liability.
(3)
Assumed healthcare cost trend rate at December 31, 2012 is assumed to decline gradually to 5.00%
by 2021 and remain level thereafter.
(4)
Our assumptions reflect various remeasurements of certain portions of our obligations and represent the weighted average of the assumptions used for each measurement date.
(in millions) 1% Increase 1% Decrease
Increase (decrease) in total service and interest cost
$
1
$
(2
)
Increase (decrease) in the accumulated plan benefit obligation
17
(29
)