Delta Airlines 2012 Annual Report Download - page 43
Download and view the complete annual report
Please find page 43 of the 2012 Delta Airlines annual report below. You can navigate through the pages in the report by either clicking on the pages listed below, or by using the keyword search tool below to find specific information within the annual report.-
 1
1 -
2
-
3
-
4
-
5
-
6
-
7
-
8
-
9
-
10
-
11
-
12
-
13
-
14
-
15
-
16
-
17
-
18
-
19
-
20
-
21
-
22
-
23
-
24
-
25
-
26
-
27
-
28
-
29
-
30
-
31
-
32
-
 33
33 -
 34
34 -
 35
35 -
 36
36 -
 37
37 -
 38
38 -
 39
39 -
 40
40 -
 41
41 -
 42
42 -
 43
43 -
 44
44 -
 45
45 -
 46
46 -
 47
47 -
 48
48 -
 49
49 -
 50
50 -
 51
51 -
 52
52 -
 53
53 -
54
-
55
-
56
-
57
-
58
-
59
-
60
-
61
-
62
-
63
-
64
-
65
-
66
-
67
-
68
-
69
-
70
-
71
-
72
-
73
-
74
-
75
-
76
-
77
-
78
-
79
-
80
-
81
-
82
-
83
-
84
-
85
-
86
-
87
-
88
-
89
-
90
-
91
-
92
-
93
-
94
-
95
-
96
-
97
-
98
-
99
-
100
-
101
-
102
-
103
-
104
-
105
-
106
-
107
-
108
-
109
-
110
-
111
-
112
-
113
-
114
-
115
-
116
-
117
-
118
-
119
-
120
-
121
-
122
-
123
-
124
-
125
-
126
-
127
-
128
-
129
-
130
-
131
-
132
-
133
-
134
-
135
-
136
-
137
-
138
-
139
-
140
-
141
-
142
-
143
-
144
-
145
-
146
-
147
-
148
-
149
-
150
-
151
-
152
-
153
-
154
-
155
-
156
-
157
-
158
-
159
-
160
-
161
-
162
-
163
-
164
-
165
-
166
-
167
-
168
-
169
-
170
-
171
-
172
-
173
-
174
-
175
-
176
-
177
-
178
-
179
-
180
-
181
-
182
-
183
-
184
-
185
-
186
-
187
-
188
-
189
-
190
-
191
-
192
-
193
-
194
-
195
-
196
-
197
-
198
-
199
-
200
-
201
-
202
-
203
-
204
-
205
-
206
-
207
-
208
-
209
-
210
-
211
-
212
-
213
-
214
-
215
-
216
-
217
-
218
-
219
-
220
-
221
-
222
-
223
-
224
-
225
-
226
-
227
-
228
-
229
-
230
-
231
-
232
-
233
-
234
-
235
-
236
-
237
-
238
-
239
-
240
-
241
-
242
-
243
-
244
-
245
-
246
-
247
-
248
-
249
-
250
-
251
-
252
-
253
-
254
-
255
-
256
-
257
-
258
-
259
-
260
-
261
-
262
-
263
-
264
-
265
-
266
-
267
-
268
-
269
-
270
-
271
-
272
-
273
-
274
-
275
-
276
-
277
-
278
-
279
-
280
-
281
-
282
-
283
-
284
-
285
-
286
-
287
-
288
-
289
-
290
-
291
-
292
-
293
-
294
-
295
-
296
-
297
-
298
-
299
-
300
-
301
-
302
-
303
-
304
-
305
-
306
-
307
-
308
-
309
-
310
-
311
-
312
-
313
-
314
-
315
-
316
-
317
-
318
-
319
-
320
-
321
-
322
-
323
-
324
-
325
-
326
-
327
-
328
-
329
-
330
-
331
-
332
-
333
-
334
-
335
-
336
-
337
-
338
-
339
-
340
-
341
-
342
-
343
-
344
-
345
-
346
-
347
-
348
-
349
-
350
-
351
-
352
-
353
-
354
-
355
-
356
-
357
-
358
-
359
-
360
-
361
-
362
-
363
-
364
-
365
-
366
-
367
-
368
-
369
-
370
-
371
-
372
-
373
-
374
-
375
-
376
-
377
-
378
-
379
-
380
-
381
-
382
-
383
-
384
-
385
-
386
-
387
-
388
-
389
-
390
-
391
-
392
-
393
-
394
-
395
-
396
-
397
-
398
-
399
-
400
-
401
-
402
-
403
-
404
-
405
-
406
-
407
-
408
-
409
-
410
-
411
-
412
-
413
-
414
-
415
-
416
-
417
-
418
-
419
-
420
-
421
-
422
-
423
-
424
 |
 |

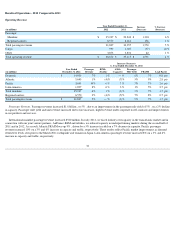
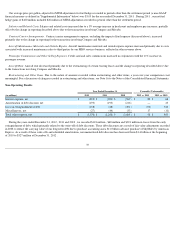
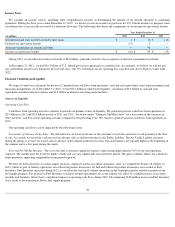
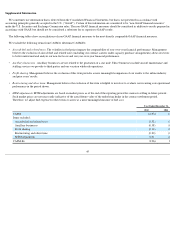
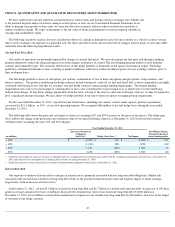
Income Taxes
We consider all income sources, including other comprehensive income, in determining the amount of tax benefit allocated to continuing
operations. During the three years ended December 31, 2012
, we did not record an income tax provision for U.S. federal income tax purposes since
our deferred tax assets are fully reserved by a valuation allowance. The following table shows the components of our income tax (provision) benefit:
During 2011, we recorded an income tax benefit of $85 million , primarily related to the recognition of alternative minimum tax refunds.
At December 31, 2012 , we had $16.3 billion of U.S. federal pre-tax net operating loss carryforwards. Accordingly, we believe we will not pay
any cash federal income taxes during the next several years. Our U.S. federal pre-tax net operating loss carryforwards do not begin to expire until
2022 .
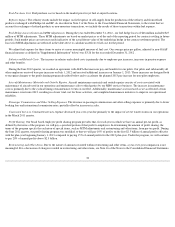
Financial Condition and Liquidity
We expect to meet our cash needs for the next 12 months from cash flows from operations, cash and cash equivalents, short-term investments and
financing arrangements. As of December 31, 2012 , we had $5.2 billion in unrestricted liquidity, consisting of $3.4 billion in cash and cash
equivalents and short-term investments and $1.8 billion in undrawn revolving credit facilities.
Sources of Liquidity
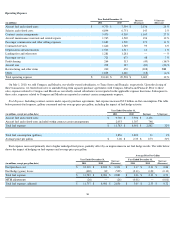
Operating Cash Flow
Cash flows from operating activities continue to provide our primary source of liquidity. We generated positive cash flows from operations of
$2.5 billion in 2012 and $2.8 billion in each of 2011 and 2010 . See below under "Timing of SkyMiles Sales" for a discussion of the variances in
2012 and 2011 cash flows from operating activities compared to the preceding years. We expect to generate positive cash flows from operations in
2013.
Our operating cash flows can be impacted by the following factors:
Seasonality of Advance Ticket Sales . We sell tickets for air travel in advance of the customer's travel date, and receive cash payment at the time
of sale. As a result, we record the cash received on advance sales as deferred revenue in Air Traffic Liability. The Air Traffic Liability increases
during the spring as we have increased sales in advance of the summer peak travel season. Our cash balances are typically higher at the beginning of
the summer and at a low point during the winter.
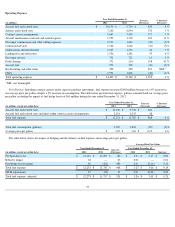
Fuel and Fuel Hedge Margins . The cost of jet fuel is our most significant expense, representing approximately 36% of our total operating
expenses. The market price for jet fuel is highly volatile and can vary significantly from period to period. This price volatility affects our cash flows
from operations, impacting comparability from period to period.
We have jet fuel inventories at various airport locations, which are used in our airline operations. Also, we acquired the Trainer oil refinery in
2012, which, as part of refinery operations, has refined oil product inventories. Jet fuel and refined oil product inventories are recorded as Fuel
Inventory. Fuel Inventory increased during 2012 as a result of the start up of refinery operations in the September quarter and the transition of our
fuel supply program. The increase in Fuel Inventory to achieve normal operating levels at our refinery was offset by a similar increase in accounts
payable, and therefore, did not have a significant impact on operating cash flows during 2012. The remaining $180 million increase in Fuel Inventory
was a result of the transition in Delta's fuel supply program.
38
Year Ended December 31,
(in millions) 2012 2011 2010
International and state income tax benefit (provision)
$
1
$
(7
)
$
(15
)
Deferred tax (provision) benefit
(17
)
2
—
Alternative minimum tax refunds and other
—
90
—
Income tax (provision) benefit
$
(16
)
$
85
$
(15
)