Delta Airlines 2012 Annual Report Download - page 45
Download and view the complete annual report
Please find page 45 of the 2012 Delta Airlines annual report below. You can navigate through the pages in the report by either clicking on the pages listed below, or by using the keyword search tool below to find specific information within the annual report.-
 1
1 -
2
-
3
-
4
-
5
-
6
-
7
-
8
-
9
-
10
-
11
-
12
-
13
-
14
-
15
-
16
-
17
-
18
-
19
-
20
-
21
-
22
-
23
-
24
-
25
-
26
-
27
-
28
-
29
-
30
-
31
-
32
-
33
-
34
-
 35
35 -
 36
36 -
 37
37 -
 38
38 -
 39
39 -
 40
40 -
 41
41 -
 42
42 -
 43
43 -
 44
44 -
 45
45 -
 46
46 -
 47
47 -
 48
48 -
 49
49 -
 50
50 -
 51
51 -
 52
52 -
 53
53 -
 54
54 -
 55
55 -
56
-
57
-
58
-
59
-
60
-
61
-
62
-
63
-
64
-
65
-
66
-
67
-
68
-
69
-
70
-
71
-
72
-
73
-
74
-
75
-
76
-
77
-
78
-
79
-
80
-
81
-
82
-
83
-
84
-
85
-
86
-
87
-
88
-
89
-
90
-
91
-
92
-
93
-
94
-
95
-
96
-
97
-
98
-
99
-
100
-
101
-
102
-
103
-
104
-
105
-
106
-
107
-
108
-
109
-
110
-
111
-
112
-
113
-
114
-
115
-
116
-
117
-
118
-
119
-
120
-
121
-
122
-
123
-
124
-
125
-
126
-
127
-
128
-
129
-
130
-
131
-
132
-
133
-
134
-
135
-
136
-
137
-
138
-
139
-
140
-
141
-
142
-
143
-
144
-
145
-
146
-
147
-
148
-
149
-
150
-
151
-
152
-
153
-
154
-
155
-
156
-
157
-
158
-
159
-
160
-
161
-
162
-
163
-
164
-
165
-
166
-
167
-
168
-
169
-
170
-
171
-
172
-
173
-
174
-
175
-
176
-
177
-
178
-
179
-
180
-
181
-
182
-
183
-
184
-
185
-
186
-
187
-
188
-
189
-
190
-
191
-
192
-
193
-
194
-
195
-
196
-
197
-
198
-
199
-
200
-
201
-
202
-
203
-
204
-
205
-
206
-
207
-
208
-
209
-
210
-
211
-
212
-
213
-
214
-
215
-
216
-
217
-
218
-
219
-
220
-
221
-
222
-
223
-
224
-
225
-
226
-
227
-
228
-
229
-
230
-
231
-
232
-
233
-
234
-
235
-
236
-
237
-
238
-
239
-
240
-
241
-
242
-
243
-
244
-
245
-
246
-
247
-
248
-
249
-
250
-
251
-
252
-
253
-
254
-
255
-
256
-
257
-
258
-
259
-
260
-
261
-
262
-
263
-
264
-
265
-
266
-
267
-
268
-
269
-
270
-
271
-
272
-
273
-
274
-
275
-
276
-
277
-
278
-
279
-
280
-
281
-
282
-
283
-
284
-
285
-
286
-
287
-
288
-
289
-
290
-
291
-
292
-
293
-
294
-
295
-
296
-
297
-
298
-
299
-
300
-
301
-
302
-
303
-
304
-
305
-
306
-
307
-
308
-
309
-
310
-
311
-
312
-
313
-
314
-
315
-
316
-
317
-
318
-
319
-
320
-
321
-
322
-
323
-
324
-
325
-
326
-
327
-
328
-
329
-
330
-
331
-
332
-
333
-
334
-
335
-
336
-
337
-
338
-
339
-
340
-
341
-
342
-
343
-
344
-
345
-
346
-
347
-
348
-
349
-
350
-
351
-
352
-
353
-
354
-
355
-
356
-
357
-
358
-
359
-
360
-
361
-
362
-
363
-
364
-
365
-
366
-
367
-
368
-
369
-
370
-
371
-
372
-
373
-
374
-
375
-
376
-
377
-
378
-
379
-
380
-
381
-
382
-
383
-
384
-
385
-
386
-
387
-
388
-
389
-
390
-
391
-
392
-
393
-
394
-
395
-
396
-
397
-
398
-
399
-
400
-
401
-
402
-
403
-
404
-
405
-
406
-
407
-
408
-
409
-
410
-
411
-
412
-
413
-
414
-
415
-
416
-
417
-
418
-
419
-
420
-
421
-
422
-
423
-
424
 |
 |

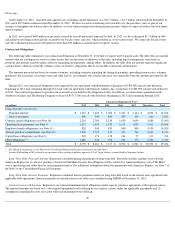
Financings
At December 31, 2012 , total debt and capital leases, including current maturities, was $12.7 billion , a $1.1 billion reduction from December 31,
2011 and a $2.5 billion reduction from December 31, 2010 . We have focused on reducing our total debt over the past three years as part of our
strategy to strengthen our balance sheet. In addition, we have refinanced previous financing transactions, which we expect to reduce our total future
interest expense.
In 2012, we received $480 million in proceeds secured by aircraft previously financed by debt. In 2012, we also refinanced $1.7 billion in debt
and undrawn revolving credit facilities secured by our Pacific routes and slots, which resulted in a lower interest rate. We expect the Pacific routes
and slots refinancing transaction will generate more than $30 million in annual interest expense savings.
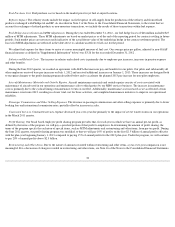
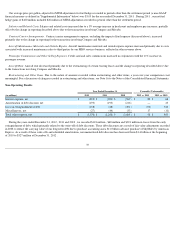
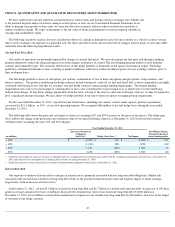
Contractual Obligations
The following table summarizes our contractual obligations at December 31, 2012 that we expect will be paid in cash. The table does not include
amounts that are contingent on events or other factors that are uncertain or unknown at this time, including legal contingencies, uncertain tax
positions and amounts payable under collective bargaining arrangements, among others. In addition, the table does not include expected significant
cash payments which are generally ordinary course of business obligations that do not include contractual commitments.
The amounts presented are based on various estimates, including estimates regarding the timing of payments, prevailing interest rates, volumes
purchased, the occurrence of certain events and other factors. Accordingly, the actual results may vary materially from the amounts presented in the
table.
During 2012, our contractual obligations were impacted by our agreement with Bombardier to purchase 40 CRJ-900 aircraft with deliveries
beginning in 2013 and continuing through 2014 and with our agreement with Pinnacle Airlines, Inc. to purchase 16 CRJ-900 aircraft with deliveries
in 2013. Our estimated payments to purchase these aircraft are included in the obligations below. In addition, we entered into agreements with
Southwest Airlines and The Boeing Company to lease 88 B-717-200 aircraft with deliveries beginning in 2013 and continuing through 2015.
Long-Term Debt, Principal Amount. Represents scheduled principal payments on long-term debt. The table excludes amounts received from
American Express for its advance purchase of restricted SkyMiles because this obligation will be satisfied by American Express' use of SkyMiles
over a specified period rather than by cash payments from us. For additional information about our agreements with American Express, see Note 7
of
the Notes to the Consolidated Financial Statements.
Long-Term Debt, Interest Payments. Represents estimated interest payments under our long-term debt based on the interest rates specified in the
applicable debt agreements. Interest payments on variable interest rate debt were calculated using LIBOR at December 31, 2012 .
Contract Carrier Obligations. Represents our estimated minimum fixed obligations under capacity purchase agreements with regional carriers.
The reported amounts are based on (1) the required minimum levels of flying by our contract carriers under the applicable agreements and (2)
assumptions regarding the costs associated with such minimum levels of flying.
40
Contractual Obligations by Year
(1)
(in millions)
2013
2014
2015 2016 2017 Thereafter Total
Long-term debt (see Note 8)
Principal amount
$
1,267
$
1,420
$
1,062
$
1,427
$
2,144
$
4,694
$
12,014
Interest payments
600
540
460
390
300
660
2,950
Contract carrier obligations (see Note 10)
2,210
2,200
2,130
1,850
1,690
3,880
13,960
Operating lease payments (see Note 9)
1,507
1,433
1,332
1,159
1,000
7,415
13,846
Employee benefit obligations (see Note 11)
820
840
830
800
800
9,930
14,020
Aircraft purchase commitments (see Note 10)
1,000
1,525
815
810
760
3,240
8,150
Capital lease obligations (see Note 9)
209
173
158
164
97
113
914
Other obligations
(2)
1,180
330
350
300
170
1,000
3,330
Total
$
8,793
$
8,461
$
7,137
$
6,900
$
6,961
$
30,932
$
69,184
(1)
For additional information, see the Notes to the Consolidated Financial Statements referenced in the table above.
(2)
Includes $360 million in 2013 related to our agreement to buy, pending regulatory approval, 49% of Virgin Atlantic, currently held by Singapore Airlines.