Delta Airlines 2012 Annual Report Download - page 33
Download and view the complete annual report
Please find page 33 of the 2012 Delta Airlines annual report below. You can navigate through the pages in the report by either clicking on the pages listed below, or by using the keyword search tool below to find specific information within the annual report.-
 1
1 -
2
-
3
-
4
-
5
-
6
-
7
-
8
-
9
-
10
-
11
-
12
-
13
-
14
-
15
-
16
-
17
-
18
-
19
-
20
-
21
-
22
-
 23
23 -
 24
24 -
 25
25 -
 26
26 -
 27
27 -
 28
28 -
 29
29 -
 30
30 -
 31
31 -
 32
32 -
 33
33 -
 34
34 -
 35
35 -
 36
36 -
 37
37 -
 38
38 -
 39
39 -
 40
40 -
 41
41 -
 42
42 -
 43
43 -
44
-
45
-
46
-
47
-
48
-
49
-
50
-
51
-
52
-
53
-
54
-
55
-
56
-
57
-
58
-
59
-
60
-
61
-
62
-
63
-
64
-
65
-
66
-
67
-
68
-
69
-
70
-
71
-
72
-
73
-
74
-
75
-
76
-
77
-
78
-
79
-
80
-
81
-
82
-
83
-
84
-
85
-
86
-
87
-
88
-
89
-
90
-
91
-
92
-
93
-
94
-
95
-
96
-
97
-
98
-
99
-
100
-
101
-
102
-
103
-
104
-
105
-
106
-
107
-
108
-
109
-
110
-
111
-
112
-
113
-
114
-
115
-
116
-
117
-
118
-
119
-
120
-
121
-
122
-
123
-
124
-
125
-
126
-
127
-
128
-
129
-
130
-
131
-
132
-
133
-
134
-
135
-
136
-
137
-
138
-
139
-
140
-
141
-
142
-
143
-
144
-
145
-
146
-
147
-
148
-
149
-
150
-
151
-
152
-
153
-
154
-
155
-
156
-
157
-
158
-
159
-
160
-
161
-
162
-
163
-
164
-
165
-
166
-
167
-
168
-
169
-
170
-
171
-
172
-
173
-
174
-
175
-
176
-
177
-
178
-
179
-
180
-
181
-
182
-
183
-
184
-
185
-
186
-
187
-
188
-
189
-
190
-
191
-
192
-
193
-
194
-
195
-
196
-
197
-
198
-
199
-
200
-
201
-
202
-
203
-
204
-
205
-
206
-
207
-
208
-
209
-
210
-
211
-
212
-
213
-
214
-
215
-
216
-
217
-
218
-
219
-
220
-
221
-
222
-
223
-
224
-
225
-
226
-
227
-
228
-
229
-
230
-
231
-
232
-
233
-
234
-
235
-
236
-
237
-
238
-
239
-
240
-
241
-
242
-
243
-
244
-
245
-
246
-
247
-
248
-
249
-
250
-
251
-
252
-
253
-
254
-
255
-
256
-
257
-
258
-
259
-
260
-
261
-
262
-
263
-
264
-
265
-
266
-
267
-
268
-
269
-
270
-
271
-
272
-
273
-
274
-
275
-
276
-
277
-
278
-
279
-
280
-
281
-
282
-
283
-
284
-
285
-
286
-
287
-
288
-
289
-
290
-
291
-
292
-
293
-
294
-
295
-
296
-
297
-
298
-
299
-
300
-
301
-
302
-
303
-
304
-
305
-
306
-
307
-
308
-
309
-
310
-
311
-
312
-
313
-
314
-
315
-
316
-
317
-
318
-
319
-
320
-
321
-
322
-
323
-
324
-
325
-
326
-
327
-
328
-
329
-
330
-
331
-
332
-
333
-
334
-
335
-
336
-
337
-
338
-
339
-
340
-
341
-
342
-
343
-
344
-
345
-
346
-
347
-
348
-
349
-
350
-
351
-
352
-
353
-
354
-
355
-
356
-
357
-
358
-
359
-
360
-
361
-
362
-
363
-
364
-
365
-
366
-
367
-
368
-
369
-
370
-
371
-
372
-
373
-
374
-
375
-
376
-
377
-
378
-
379
-
380
-
381
-
382
-
383
-
384
-
385
-
386
-
387
-
388
-
389
-
390
-
391
-
392
-
393
-
394
-
395
-
396
-
397
-
398
-
399
-
400
-
401
-
402
-
403
-
404
-
405
-
406
-
407
-
408
-
409
-
410
-
411
-
412
-
413
-
414
-
415
-
416
-
417
-
418
-
419
-
420
-
421
-
422
-
423
-
424
 |
 |

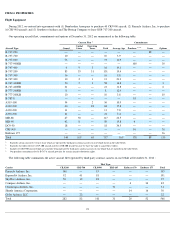
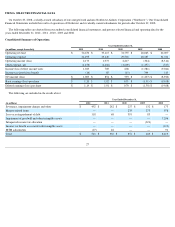
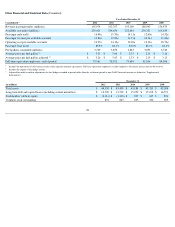
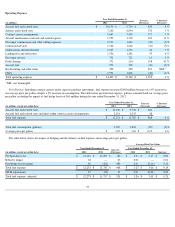
Other Financial and Statistical Data (Unaudited)
28
Year Ended December 31,
Consolidated
(1)
2012 2011 2010 2009 2008
Revenue passenger miles (millions)
192,974
192,767
193,169
188,943
134,879
Available seat miles (millions)
230,415
234,656
232,684
230,331
165,639
Passenger mile yield
16.48
¢
15.70
¢
14.11
¢
12.60
¢
14.52
¢
Passenger revenue per available seat mile
13.80
¢
12.89
¢
11.71
¢
10.34
¢
11.82
¢
Operating cost per available seat mile
14.97
¢
14.12
¢
12.69
¢
12.32
¢
18.72
¢
Passenger load factor
83.8
%
82.1
%
83.0
%
82.0
%
81.4
%
Fuel gallons consumed (millions)
3,769
3,856
3,823
3,853
2,740
Average price per fuel gallon
(2)
$
3.25
$
3.06
$
2.33
$
2.15
$
3.16
Average price per fuel gallon, adjusted
(3)
$
3.26
$
3.05
$
2.33
$
2.15
$
3.13
Full-time equivalent employees, end of period
73,561
78,392
79,684
81,106
84,306
(1)
Includes the operations of our contract carriers under capacity purchase agreements. Full-
time equivalent employees exclude employees of contract carriers that we do not own.
(2)
Includes the impact of fuel hedge activity.
(3)
Adjusted for mark-to-market adjustments for fuel hedges recorded in periods other than the settlement period (a non-GAAP financial measure as defined in "Supplemental
Information").
December 31,
(in millions) 2012 2011 2010 2009 2008
Total assets
$
44,550
$
43,499
$
43,188
$
43,789
$
45,084
Long-term debt and capital leases (including current maturities)
$
12,709
$
13,791
$
15,252
$
17,198
$
16,571
Stockholders' (deficit) equity
$
(2,131
)
$
(1,396
)
$
897
$
245
$
874
Common stock outstanding
851
845
835
784
695