Delta Airlines 2012 Annual Report Download - page 95
Download and view the complete annual report
Please find page 95 of the 2012 Delta Airlines annual report below. You can navigate through the pages in the report by either clicking on the pages listed below, or by using the keyword search tool below to find specific information within the annual report.-
 1
1 -
2
-
3
-
4
-
5
-
6
-
7
-
8
-
9
-
10
-
11
-
12
-
13
-
14
-
15
-
16
-
17
-
18
-
19
-
20
-
21
-
22
-
23
-
24
-
25
-
26
-
27
-
28
-
29
-
30
-
31
-
32
-
33
-
34
-
35
-
36
-
37
-
38
-
39
-
40
-
41
-
42
-
43
-
44
-
45
-
46
-
47
-
48
-
49
-
50
-
51
-
52
-
53
-
54
-
55
-
56
-
57
-
58
-
59
-
60
-
61
-
62
-
63
-
64
-
65
-
66
-
67
-
68
-
69
-
70
-
71
-
72
-
73
-
74
-
75
-
76
-
77
-
78
-
79
-
80
-
81
-
82
-
83
-
84
-
 85
85 -
 86
86 -
 87
87 -
 88
88 -
 89
89 -
 90
90 -
 91
91 -
 92
92 -
 93
93 -
 94
94 -
 95
95 -
 96
96 -
 97
97 -
 98
98 -
 99
99 -
 100
100 -
 101
101 -
 102
102 -
 103
103 -
 104
104 -
 105
105 -
106
-
107
-
108
-
109
-
110
-
111
-
112
-
113
-
114
-
115
-
116
-
117
-
118
-
119
-
120
-
121
-
122
-
123
-
124
-
125
-
126
-
127
-
128
-
129
-
130
-
131
-
132
-
133
-
134
-
135
-
136
-
137
-
138
-
139
-
140
-
141
-
142
-
143
-
144
-
145
-
146
-
147
-
148
-
149
-
150
-
151
-
152
-
153
-
154
-
155
-
156
-
157
-
158
-
159
-
160
-
161
-
162
-
163
-
164
-
165
-
166
-
167
-
168
-
169
-
170
-
171
-
172
-
173
-
174
-
175
-
176
-
177
-
178
-
179
-
180
-
181
-
182
-
183
-
184
-
185
-
186
-
187
-
188
-
189
-
190
-
191
-
192
-
193
-
194
-
195
-
196
-
197
-
198
-
199
-
200
-
201
-
202
-
203
-
204
-
205
-
206
-
207
-
208
-
209
-
210
-
211
-
212
-
213
-
214
-
215
-
216
-
217
-
218
-
219
-
220
-
221
-
222
-
223
-
224
-
225
-
226
-
227
-
228
-
229
-
230
-
231
-
232
-
233
-
234
-
235
-
236
-
237
-
238
-
239
-
240
-
241
-
242
-
243
-
244
-
245
-
246
-
247
-
248
-
249
-
250
-
251
-
252
-
253
-
254
-
255
-
256
-
257
-
258
-
259
-
260
-
261
-
262
-
263
-
264
-
265
-
266
-
267
-
268
-
269
-
270
-
271
-
272
-
273
-
274
-
275
-
276
-
277
-
278
-
279
-
280
-
281
-
282
-
283
-
284
-
285
-
286
-
287
-
288
-
289
-
290
-
291
-
292
-
293
-
294
-
295
-
296
-
297
-
298
-
299
-
300
-
301
-
302
-
303
-
304
-
305
-
306
-
307
-
308
-
309
-
310
-
311
-
312
-
313
-
314
-
315
-
316
-
317
-
318
-
319
-
320
-
321
-
322
-
323
-
324
-
325
-
326
-
327
-
328
-
329
-
330
-
331
-
332
-
333
-
334
-
335
-
336
-
337
-
338
-
339
-
340
-
341
-
342
-
343
-
344
-
345
-
346
-
347
-
348
-
349
-
350
-
351
-
352
-
353
-
354
-
355
-
356
-
357
-
358
-
359
-
360
-
361
-
362
-
363
-
364
-
365
-
366
-
367
-
368
-
369
-
370
-
371
-
372
-
373
-
374
-
375
-
376
-
377
-
378
-
379
-
380
-
381
-
382
-
383
-
384
-
385
-
386
-
387
-
388
-
389
-
390
-
391
-
392
-
393
-
394
-
395
-
396
-
397
-
398
-
399
-
400
-
401
-
402
-
403
-
404
-
405
-
406
-
407
-
408
-
409
-
410
-
411
-
412
-
413
-
414
-
415
-
416
-
417
-
418
-
419
-
420
-
421
-
422
-
423
-
424
 |
 |

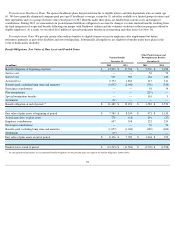
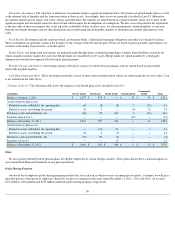
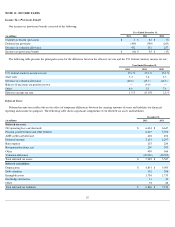
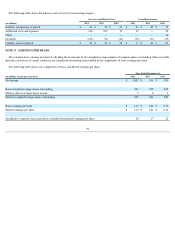
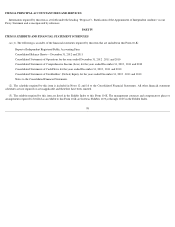
The following table shows the current and noncurrent deferred tax assets (liabilities):
The current and noncurrent components of our deferred tax balances are generally based on the balance sheet classification of the asset or liability
creating the temporary difference. If the deferred tax asset or liability is not based on a component of our balance sheet, such as our net operating loss
(“NOL”) carryforwards, the classification is presented based on the expected reversal date of the temporary difference. Our valuation allowance has
been allocated between current or noncurrent based on the percentages of current and noncurrent deferred tax assets to total deferred tax assets.
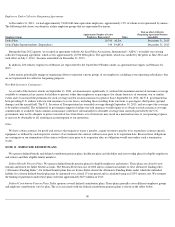
At December 31, 2012 , we had (1) $402 million of federal alternative minimum tax (“AMT”) credit carryforwards, which do not expire and (2)
$16.3 billion of federal pretax NOL carryforwards, which will not begin to expire until 2022 .
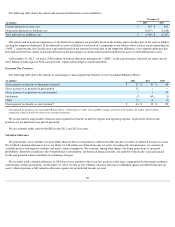
Uncertain Tax Positions
The following table shows the amount of and changes to unrecognized tax benefits on our Consolidated Balance Sheets:
We accrue interest and penalties related to unrecognized tax benefits in interest expense and operating expense, respectively. Interest and
penalties are not material in any period presented.
We are currently under audit by the IRS for the 2011 and 2012 tax years.
Valuation Allowance
We periodically assess whether it is more likely than not that we will generate sufficient taxable income to realize our deferred income tax assets.
We establish valuation allowances if it is not likely we will realize our deferred income tax assets. In making this determination, we consider all
available positive and negative evidence and make certain assumptions. We consider, among other things, our future projections of sustained
profitability, deferred tax liabilities, the overall business environment, our historical financial results, our industry's historically cyclical financial
results and potential current and future tax planning strategies.
We recorded a full valuation allowance in 2004 due to our cumulative three year loss position at that time, compounded by the negative industry-
wide business trends and outlook. At December 31, 2012, we had an $11.0 billion valuation allowance established against our deferred income tax
assets, which represents a full valuation allowance against our net deferred income tax asset.
88
December 31,
(in millions) 2012 2011
Current deferred tax assets, net
$
463
$
461
Noncurrent deferred tax liabilities, net
(2,047
)
(2,028
)
Total deferred tax liabilities, net
$
(1,584
)
$
(1,567
)
(in millions) 2012 2011 2010
Unrecognized tax benefits at beginning of period
$
22
$
89
$
66
Gross increases-tax positions in prior period
31
1
—
Gross increases-tax positions in current period
2
1
29
Settlements
(2
)
(65
)
(1
)
Other
(9
)
(4
)
(5
)
Unrecognized tax benefits at end of period
(1)
$
44
$
22
$
89
(1)
Unrecognized tax benefits on our Consolidated Balance Sheets as of December 31, 2012 , 2011 and 2010 , include tax benefits of $12 million , $5 million and $72 million ,
respectively, which will affect the effective tax rate when recognized.