Delta Airlines 2012 Annual Report Download - page 60
Download and view the complete annual report
Please find page 60 of the 2012 Delta Airlines annual report below. You can navigate through the pages in the report by either clicking on the pages listed below, or by using the keyword search tool below to find specific information within the annual report.-
 1
1 -
2
-
3
-
4
-
5
-
6
-
7
-
8
-
9
-
10
-
11
-
12
-
13
-
14
-
15
-
16
-
17
-
18
-
19
-
20
-
21
-
22
-
23
-
24
-
25
-
26
-
27
-
28
-
29
-
30
-
31
-
32
-
33
-
34
-
35
-
36
-
37
-
38
-
39
-
40
-
41
-
42
-
43
-
44
-
45
-
46
-
47
-
48
-
49
-
 50
50 -
 51
51 -
 52
52 -
 53
53 -
 54
54 -
 55
55 -
 56
56 -
 57
57 -
 58
58 -
 59
59 -
 60
60 -
 61
61 -
 62
62 -
 63
63 -
 64
64 -
 65
65 -
 66
66 -
 67
67 -
 68
68 -
 69
69 -
 70
70 -
71
-
72
-
73
-
74
-
75
-
76
-
77
-
78
-
79
-
80
-
81
-
82
-
83
-
84
-
85
-
86
-
87
-
88
-
89
-
90
-
91
-
92
-
93
-
94
-
95
-
96
-
97
-
98
-
99
-
100
-
101
-
102
-
103
-
104
-
105
-
106
-
107
-
108
-
109
-
110
-
111
-
112
-
113
-
114
-
115
-
116
-
117
-
118
-
119
-
120
-
121
-
122
-
123
-
124
-
125
-
126
-
127
-
128
-
129
-
130
-
131
-
132
-
133
-
134
-
135
-
136
-
137
-
138
-
139
-
140
-
141
-
142
-
143
-
144
-
145
-
146
-
147
-
148
-
149
-
150
-
151
-
152
-
153
-
154
-
155
-
156
-
157
-
158
-
159
-
160
-
161
-
162
-
163
-
164
-
165
-
166
-
167
-
168
-
169
-
170
-
171
-
172
-
173
-
174
-
175
-
176
-
177
-
178
-
179
-
180
-
181
-
182
-
183
-
184
-
185
-
186
-
187
-
188
-
189
-
190
-
191
-
192
-
193
-
194
-
195
-
196
-
197
-
198
-
199
-
200
-
201
-
202
-
203
-
204
-
205
-
206
-
207
-
208
-
209
-
210
-
211
-
212
-
213
-
214
-
215
-
216
-
217
-
218
-
219
-
220
-
221
-
222
-
223
-
224
-
225
-
226
-
227
-
228
-
229
-
230
-
231
-
232
-
233
-
234
-
235
-
236
-
237
-
238
-
239
-
240
-
241
-
242
-
243
-
244
-
245
-
246
-
247
-
248
-
249
-
250
-
251
-
252
-
253
-
254
-
255
-
256
-
257
-
258
-
259
-
260
-
261
-
262
-
263
-
264
-
265
-
266
-
267
-
268
-
269
-
270
-
271
-
272
-
273
-
274
-
275
-
276
-
277
-
278
-
279
-
280
-
281
-
282
-
283
-
284
-
285
-
286
-
287
-
288
-
289
-
290
-
291
-
292
-
293
-
294
-
295
-
296
-
297
-
298
-
299
-
300
-
301
-
302
-
303
-
304
-
305
-
306
-
307
-
308
-
309
-
310
-
311
-
312
-
313
-
314
-
315
-
316
-
317
-
318
-
319
-
320
-
321
-
322
-
323
-
324
-
325
-
326
-
327
-
328
-
329
-
330
-
331
-
332
-
333
-
334
-
335
-
336
-
337
-
338
-
339
-
340
-
341
-
342
-
343
-
344
-
345
-
346
-
347
-
348
-
349
-
350
-
351
-
352
-
353
-
354
-
355
-
356
-
357
-
358
-
359
-
360
-
361
-
362
-
363
-
364
-
365
-
366
-
367
-
368
-
369
-
370
-
371
-
372
-
373
-
374
-
375
-
376
-
377
-
378
-
379
-
380
-
381
-
382
-
383
-
384
-
385
-
386
-
387
-
388
-
389
-
390
-
391
-
392
-
393
-
394
-
395
-
396
-
397
-
398
-
399
-
400
-
401
-
402
-
403
-
404
-
405
-
406
-
407
-
408
-
409
-
410
-
411
-
412
-
413
-
414
-
415
-
416
-
417
-
418
-
419
-
420
-
421
-
422
-
423
-
424
 |
 |

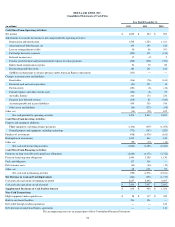
DELTA AIR LINES, INC.
Consolidated Statements of Cash Flows
54
Year Ended December 31,
(in millions) 2012
2011
2010
Cash Flows From Operating Activities:
Net income
$
1,009
$
854
$
593
Adjustments to reconcile net income to net cash provided by operating activities:
Depreciation and amortization
1,565
1,523
1,511
Amortization of debt discount, net
193
193
216
Loss on extinguishment of debt
56
68
391
Fuel hedge derivative contracts
(209
)
135
(136
)
Deferred income taxes
17
(2
)
9
Pension, postretirement and postemployment expense less than payments
(208
)
(308
)
(301
)
Equity-based compensation expense
54
72
89
Restructuring and other items
184
142
182
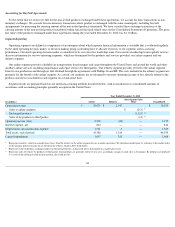
SkyMiles used pursuant to advance purchase under American Express Agreements
(333
)
—
—
Changes in certain assets and liabilities:
Receivables
(116
)
(76
)
(141
)
Restricted cash and cash equivalents
(51
)
153
16
Fuel inventory
(451
)
(8
)
(36
)
Prepaid expenses and other current assets
(134
)
(8
)
29
Air traffic liability
216
174
232
Frequent flyer deferred revenue
(115
)
82
(345
)
Accounts payable and accrued liabilities
899
303
516
Other assets and liabilities
(66
)
(373
)
(98
)
Other, net
(34
)
(90
)
105
Net cash provided by operating activities
2,476
2,834
2,832
Cash Flows From Investing Activities:
Property and equipment additions:
Flight equipment, including advance payments
(1,196
)
(907
)
(1,055
)
Ground property and equipment, including technology
(772
)
(347
)
(287
)
Purchase of investments
(958
)
(1,078
)
(815
)
Redemption of investments
1,019
844
149
Other, net
(55
)
(10
)
(18
)
Net cash used in investing activities
(1,962
)
(1,498
)
(2,026
)
Cash Flows From Financing Activities:
Payments on long-term debt and capital lease obligations
(2,864
)
(4,172
)
(3,722
)
Proceeds from long-term obligations
1,965
2,395
1,130
Fuel card obligation
137
318
—
Debt issuance costs
(41
)
(63
)
(19
)
Other, net
48
(49)
90
Net cash used in financing activities
(755
)
(1,571
)
(2,521
)
Net Decrease in Cash and Cash Equivalents
(241
)
(235
)
(1,715
)
Cash and cash equivalents at beginning of period
2,657
2,892
4,607
Cash and cash equivalents at end of period
$
2,416
$
2,657
$
2,892
Supplemental Disclosure of Cash Paid for Interest
$
834
$
925
$
1,036
Non-Cash Transactions:
Flight equipment under capital leases
$
28
$
117
$
329
Built-to-suit leased facilities
214
126
—
Debt relief through vendor negotiations
—
—
160
Debt discount on American Express agreements
—
—
110
The accompanying notes are an integral part of these Consolidated Financial Statements.