Delta Airlines 2012 Annual Report Download - page 50
Download and view the complete annual report
Please find page 50 of the 2012 Delta Airlines annual report below. You can navigate through the pages in the report by either clicking on the pages listed below, or by using the keyword search tool below to find specific information within the annual report.-
 1
1 -
2
-
3
-
4
-
5
-
6
-
7
-
8
-
9
-
10
-
11
-
12
-
13
-
14
-
15
-
16
-
17
-
18
-
19
-
20
-
21
-
22
-
23
-
24
-
25
-
26
-
27
-
28
-
29
-
30
-
31
-
32
-
33
-
34
-
35
-
36
-
37
-
38
-
39
-
 40
40 -
 41
41 -
 42
42 -
 43
43 -
 44
44 -
 45
45 -
 46
46 -
 47
47 -
 48
48 -
 49
49 -
 50
50 -
 51
51 -
 52
52 -
 53
53 -
 54
54 -
 55
55 -
 56
56 -
 57
57 -
 58
58 -
 59
59 -
 60
60 -
61
-
62
-
63
-
64
-
65
-
66
-
67
-
68
-
69
-
70
-
71
-
72
-
73
-
74
-
75
-
76
-
77
-
78
-
79
-
80
-
81
-
82
-
83
-
84
-
85
-
86
-
87
-
88
-
89
-
90
-
91
-
92
-
93
-
94
-
95
-
96
-
97
-
98
-
99
-
100
-
101
-
102
-
103
-
104
-
105
-
106
-
107
-
108
-
109
-
110
-
111
-
112
-
113
-
114
-
115
-
116
-
117
-
118
-
119
-
120
-
121
-
122
-
123
-
124
-
125
-
126
-
127
-
128
-
129
-
130
-
131
-
132
-
133
-
134
-
135
-
136
-
137
-
138
-
139
-
140
-
141
-
142
-
143
-
144
-
145
-
146
-
147
-
148
-
149
-
150
-
151
-
152
-
153
-
154
-
155
-
156
-
157
-
158
-
159
-
160
-
161
-
162
-
163
-
164
-
165
-
166
-
167
-
168
-
169
-
170
-
171
-
172
-
173
-
174
-
175
-
176
-
177
-
178
-
179
-
180
-
181
-
182
-
183
-
184
-
185
-
186
-
187
-
188
-
189
-
190
-
191
-
192
-
193
-
194
-
195
-
196
-
197
-
198
-
199
-
200
-
201
-
202
-
203
-
204
-
205
-
206
-
207
-
208
-
209
-
210
-
211
-
212
-
213
-
214
-
215
-
216
-
217
-
218
-
219
-
220
-
221
-
222
-
223
-
224
-
225
-
226
-
227
-
228
-
229
-
230
-
231
-
232
-
233
-
234
-
235
-
236
-
237
-
238
-
239
-
240
-
241
-
242
-
243
-
244
-
245
-
246
-
247
-
248
-
249
-
250
-
251
-
252
-
253
-
254
-
255
-
256
-
257
-
258
-
259
-
260
-
261
-
262
-
263
-
264
-
265
-
266
-
267
-
268
-
269
-
270
-
271
-
272
-
273
-
274
-
275
-
276
-
277
-
278
-
279
-
280
-
281
-
282
-
283
-
284
-
285
-
286
-
287
-
288
-
289
-
290
-
291
-
292
-
293
-
294
-
295
-
296
-
297
-
298
-
299
-
300
-
301
-
302
-
303
-
304
-
305
-
306
-
307
-
308
-
309
-
310
-
311
-
312
-
313
-
314
-
315
-
316
-
317
-
318
-
319
-
320
-
321
-
322
-
323
-
324
-
325
-
326
-
327
-
328
-
329
-
330
-
331
-
332
-
333
-
334
-
335
-
336
-
337
-
338
-
339
-
340
-
341
-
342
-
343
-
344
-
345
-
346
-
347
-
348
-
349
-
350
-
351
-
352
-
353
-
354
-
355
-
356
-
357
-
358
-
359
-
360
-
361
-
362
-
363
-
364
-
365
-
366
-
367
-
368
-
369
-
370
-
371
-
372
-
373
-
374
-
375
-
376
-
377
-
378
-
379
-
380
-
381
-
382
-
383
-
384
-
385
-
386
-
387
-
388
-
389
-
390
-
391
-
392
-
393
-
394
-
395
-
396
-
397
-
398
-
399
-
400
-
401
-
402
-
403
-
404
-
405
-
406
-
407
-
408
-
409
-
410
-
411
-
412
-
413
-
414
-
415
-
416
-
417
-
418
-
419
-
420
-
421
-
422
-
423
-
424
 |
 |

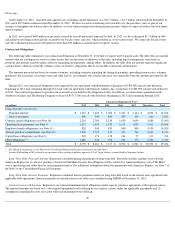
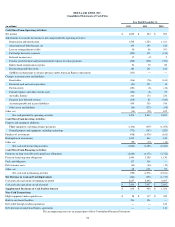
Supplemental Information
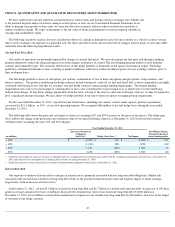
We sometimes use information that is derived from the Consolidated Financial Statements, but that is not presented in accordance with
accounting principles generally accepted in the U.S. (“GAAP”). Certain of this information are considered to be “non-GAAP financial measures”
under the U.S. Securities and Exchange Commission rules. The non-
GAAP financial measures should be considered in addition to results prepared in
accordance with GAAP, but should not be considered a substitute for or superior to GAAP results.
The following tables show reconciliations of non-GAAP financial measures to the most directly comparable GAAP financial measures.
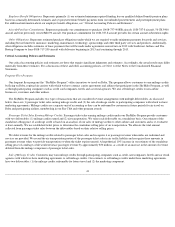
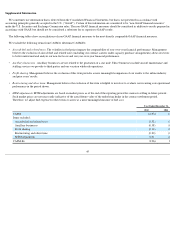
We exclude the following items from CASM to determine CASM-Ex:
45
•
Aircraft fuel and related taxes.
The volatility in fuel prices impacts the comparability of year-over-year financial performance. Management
believes the exclusion of aircraft fuel and related taxes (including our contract carriers under capacity purchase arrangements) allows investors
to better understand and analyze our non-fuel costs and our year-over-year financial performance.
•
Ancillary businesses
. Ancillary businesses are not related to the generation of a seat mile. These businesses include aircraft maintenance and
staffing services we provide to third parties and our vacation wholesale operations.
•
Profit sharing.
Management believes the exclusion of this item provides a more meaningful comparison of our results to the airline industry
and prior years' results.
•
Restructuring and other items.
Management believes the exclusion of this item is helpful to investors to evaluate our recurring core operational
performance in the period shown.
•
MTM adjustments.
MTM adjustments are based on market prices as of the end of the reporting period for contracts settling in future periods .
Such market prices are not necessarily indicative of the actual future value of the underlying hedge in the contract settlement period.
Therefore, we adjust fuel expense for these items to arrive at a more meaningful measure of fuel cost.
Year Ended December 31,
2012 2011
CASM
14.97
¢
14
Items excluded:
Aircraft fuel and related taxes
(5.32
)
(5
Ancillary businesses
(0.38
)
(0
Profit sharing
(0.16
)
(0
Restructuring and other items
(0.20
)
(0
MTM adjustments
0.01
(0
CASM-Ex
8.92
¢
8