Delta Airlines 2012 Annual Report Download - page 101
Download and view the complete annual report
Please find page 101 of the 2012 Delta Airlines annual report below. You can navigate through the pages in the report by either clicking on the pages listed below, or by using the keyword search tool below to find specific information within the annual report.-
 1
1 -
2
-
3
-
4
-
5
-
6
-
7
-
8
-
9
-
10
-
11
-
12
-
13
-
14
-
15
-
16
-
17
-
18
-
19
-
20
-
21
-
22
-
23
-
24
-
25
-
26
-
27
-
28
-
29
-
30
-
31
-
32
-
33
-
34
-
35
-
36
-
37
-
38
-
39
-
40
-
41
-
42
-
43
-
44
-
45
-
46
-
47
-
48
-
49
-
50
-
51
-
52
-
53
-
54
-
55
-
56
-
57
-
58
-
59
-
60
-
61
-
62
-
63
-
64
-
65
-
66
-
67
-
68
-
69
-
70
-
71
-
72
-
73
-
74
-
75
-
76
-
77
-
78
-
79
-
80
-
81
-
82
-
83
-
84
-
85
-
86
-
87
-
88
-
89
-
90
-
 91
91 -
 92
92 -
 93
93 -
 94
94 -
 95
95 -
 96
96 -
 97
97 -
 98
98 -
 99
99 -
 100
100 -
 101
101 -
 102
102 -
 103
103 -
 104
104 -
 105
105 -
 106
106 -
 107
107 -
 108
108 -
 109
109 -
 110
110 -
 111
111 -
112
-
113
-
114
-
115
-
116
-
117
-
118
-
119
-
120
-
121
-
122
-
123
-
124
-
125
-
126
-
127
-
128
-
129
-
130
-
131
-
132
-
133
-
134
-
135
-
136
-
137
-
138
-
139
-
140
-
141
-
142
-
143
-
144
-
145
-
146
-
147
-
148
-
149
-
150
-
151
-
152
-
153
-
154
-
155
-
156
-
157
-
158
-
159
-
160
-
161
-
162
-
163
-
164
-
165
-
166
-
167
-
168
-
169
-
170
-
171
-
172
-
173
-
174
-
175
-
176
-
177
-
178
-
179
-
180
-
181
-
182
-
183
-
184
-
185
-
186
-
187
-
188
-
189
-
190
-
191
-
192
-
193
-
194
-
195
-
196
-
197
-
198
-
199
-
200
-
201
-
202
-
203
-
204
-
205
-
206
-
207
-
208
-
209
-
210
-
211
-
212
-
213
-
214
-
215
-
216
-
217
-
218
-
219
-
220
-
221
-
222
-
223
-
224
-
225
-
226
-
227
-
228
-
229
-
230
-
231
-
232
-
233
-
234
-
235
-
236
-
237
-
238
-
239
-
240
-
241
-
242
-
243
-
244
-
245
-
246
-
247
-
248
-
249
-
250
-
251
-
252
-
253
-
254
-
255
-
256
-
257
-
258
-
259
-
260
-
261
-
262
-
263
-
264
-
265
-
266
-
267
-
268
-
269
-
270
-
271
-
272
-
273
-
274
-
275
-
276
-
277
-
278
-
279
-
280
-
281
-
282
-
283
-
284
-
285
-
286
-
287
-
288
-
289
-
290
-
291
-
292
-
293
-
294
-
295
-
296
-
297
-
298
-
299
-
300
-
301
-
302
-
303
-
304
-
305
-
306
-
307
-
308
-
309
-
310
-
311
-
312
-
313
-
314
-
315
-
316
-
317
-
318
-
319
-
320
-
321
-
322
-
323
-
324
-
325
-
326
-
327
-
328
-
329
-
330
-
331
-
332
-
333
-
334
-
335
-
336
-
337
-
338
-
339
-
340
-
341
-
342
-
343
-
344
-
345
-
346
-
347
-
348
-
349
-
350
-
351
-
352
-
353
-
354
-
355
-
356
-
357
-
358
-
359
-
360
-
361
-
362
-
363
-
364
-
365
-
366
-
367
-
368
-
369
-
370
-
371
-
372
-
373
-
374
-
375
-
376
-
377
-
378
-
379
-
380
-
381
-
382
-
383
-
384
-
385
-
386
-
387
-
388
-
389
-
390
-
391
-
392
-
393
-
394
-
395
-
396
-
397
-
398
-
399
-
400
-
401
-
402
-
403
-
404
-
405
-
406
-
407
-
408
-
409
-
410
-
411
-
412
-
413
-
414
-
415
-
416
-
417
-
418
-
419
-
420
-
421
-
422
-
423
-
424
 |
 |

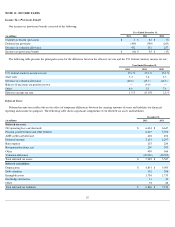
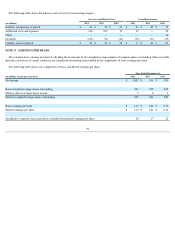
NOTE 18 . QUARTERLY FINANCIAL DATA (UNAUDITED)
The following table summarizes our unaudited results of operations on a quarterly basis. The quarterly earnings (loss) per share amounts for a
year will not add to the earnings per share for that year due to the weighting of shares used in calculating per share data.
The following are included in the results above:
94
Three Months Ended
(in millions, except per share data) March 31 June 30 September 30 December 31
2012
Operating revenue
$
8,413
$
9,732
$
9,923
$
8,602
Operating income
382
134
1,308
352
Net income (loss)
124
(168
)
1,047
7
Basic earnings (loss) per share
$
0.15
$
(0.20
)
$
1.24
$
0.01
Diluted earnings (loss) per share
$
0.15
$
(0.20
)
$
1.23
$
0.01
2011
Operating revenue
$
7,747
$
9,153
$
9,816
$
8,399
Operating (loss) income
(92
)
481
860
726
Net (loss) income
(318
)
198
549
425
Basic (loss) earnings per share
$
(0.38
)
$
0.24
$
0.66
$
0.51
Diluted (loss) earnings per share
$
(0.38
)
$
0.23
$
0.65
$
0.50
Three Months Ended
(in millions) March 31 June 30 September 30 December 31
2012
Severance and related cost
$
—
$
(
171
)
$
(66
)
$
—
Facilities, fleet and other
(27
)
(22
)
(122
)
(122
)
Gain on slot exchange
39
—
39
—
Loss on extinguishment of debt
—
—
(
12
)
(106
)
MTM adjustments
151
(561
)
440
(3
)
Total income (loss)
$
163
$
(754
)
$
279
$
(231
)
2011
Severance and related cost
$
—
$
(
80
)
$
(3
)
$
(52
)
Facilities, fleet and other
(7
)
(64
)
—
(
29
)
Intangible asset impairment
—
—
—
(
50
)
Gain on divestiture of slots
—
—
—
43
Loss on extinguishment of debt
(20
)
(13
)
(5
)
(30
)
MTM adjustments
29
(11
)
(208
)
164
Total income (loss)
$
2
$
(168
)
$
(216
)
$
46