Delta Airlines 2012 Annual Report Download - page 89
Download and view the complete annual report
Please find page 89 of the 2012 Delta Airlines annual report below. You can navigate through the pages in the report by either clicking on the pages listed below, or by using the keyword search tool below to find specific information within the annual report.-
 1
1 -
2
-
3
-
4
-
5
-
6
-
7
-
8
-
9
-
10
-
11
-
12
-
13
-
14
-
15
-
16
-
17
-
18
-
19
-
20
-
21
-
22
-
23
-
24
-
25
-
26
-
27
-
28
-
29
-
30
-
31
-
32
-
33
-
34
-
35
-
36
-
37
-
38
-
39
-
40
-
41
-
42
-
43
-
44
-
45
-
46
-
47
-
48
-
49
-
50
-
51
-
52
-
53
-
54
-
55
-
56
-
57
-
58
-
59
-
60
-
61
-
62
-
63
-
64
-
65
-
66
-
67
-
68
-
69
-
70
-
71
-
72
-
73
-
74
-
75
-
76
-
77
-
78
-
 79
79 -
 80
80 -
 81
81 -
 82
82 -
 83
83 -
 84
84 -
 85
85 -
 86
86 -
 87
87 -
 88
88 -
 89
89 -
 90
90 -
 91
91 -
 92
92 -
 93
93 -
 94
94 -
 95
95 -
 96
96 -
 97
97 -
 98
98 -
 99
99 -
100
-
101
-
102
-
103
-
104
-
105
-
106
-
107
-
108
-
109
-
110
-
111
-
112
-
113
-
114
-
115
-
116
-
117
-
118
-
119
-
120
-
121
-
122
-
123
-
124
-
125
-
126
-
127
-
128
-
129
-
130
-
131
-
132
-
133
-
134
-
135
-
136
-
137
-
138
-
139
-
140
-
141
-
142
-
143
-
144
-
145
-
146
-
147
-
148
-
149
-
150
-
151
-
152
-
153
-
154
-
155
-
156
-
157
-
158
-
159
-
160
-
161
-
162
-
163
-
164
-
165
-
166
-
167
-
168
-
169
-
170
-
171
-
172
-
173
-
174
-
175
-
176
-
177
-
178
-
179
-
180
-
181
-
182
-
183
-
184
-
185
-
186
-
187
-
188
-
189
-
190
-
191
-
192
-
193
-
194
-
195
-
196
-
197
-
198
-
199
-
200
-
201
-
202
-
203
-
204
-
205
-
206
-
207
-
208
-
209
-
210
-
211
-
212
-
213
-
214
-
215
-
216
-
217
-
218
-
219
-
220
-
221
-
222
-
223
-
224
-
225
-
226
-
227
-
228
-
229
-
230
-
231
-
232
-
233
-
234
-
235
-
236
-
237
-
238
-
239
-
240
-
241
-
242
-
243
-
244
-
245
-
246
-
247
-
248
-
249
-
250
-
251
-
252
-
253
-
254
-
255
-
256
-
257
-
258
-
259
-
260
-
261
-
262
-
263
-
264
-
265
-
266
-
267
-
268
-
269
-
270
-
271
-
272
-
273
-
274
-
275
-
276
-
277
-
278
-
279
-
280
-
281
-
282
-
283
-
284
-
285
-
286
-
287
-
288
-
289
-
290
-
291
-
292
-
293
-
294
-
295
-
296
-
297
-
298
-
299
-
300
-
301
-
302
-
303
-
304
-
305
-
306
-
307
-
308
-
309
-
310
-
311
-
312
-
313
-
314
-
315
-
316
-
317
-
318
-
319
-
320
-
321
-
322
-
323
-
324
-
325
-
326
-
327
-
328
-
329
-
330
-
331
-
332
-
333
-
334
-
335
-
336
-
337
-
338
-
339
-
340
-
341
-
342
-
343
-
344
-
345
-
346
-
347
-
348
-
349
-
350
-
351
-
352
-
353
-
354
-
355
-
356
-
357
-
358
-
359
-
360
-
361
-
362
-
363
-
364
-
365
-
366
-
367
-
368
-
369
-
370
-
371
-
372
-
373
-
374
-
375
-
376
-
377
-
378
-
379
-
380
-
381
-
382
-
383
-
384
-
385
-
386
-
387
-
388
-
389
-
390
-
391
-
392
-
393
-
394
-
395
-
396
-
397
-
398
-
399
-
400
-
401
-
402
-
403
-
404
-
405
-
406
-
407
-
408
-
409
-
410
-
411
-
412
-
413
-
414
-
415
-
416
-
417
-
418
-
419
-
420
-
421
-
422
-
423
-
424
 |
 |

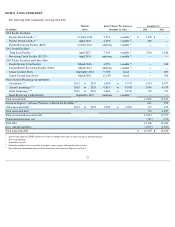
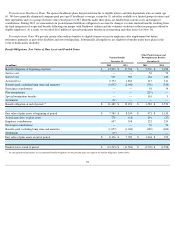
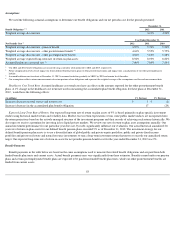
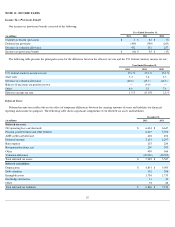
Balance Sheet Position
During 2012 , the net actuarial loss recorded in AOCI related to our benefit plans increased to $8.2 billion from $6.3 billion . This increase is
primarily due to the decrease in discount rates from 2011 to 2012 .
Estimated amounts that will be amortized from AOCI into net periodic benefit cost in 2013 are a net actuarial loss of $220 million . Amounts are
generally amortized from AOCI over the expected future lifetime of plan participants.
Net Periodic Cost
82
Pension Benefits
Other Postretirement and
Postemployment Benefits
December 31,
December 31,
(in millions) 2012 2011
2012 2011
Current liabilities
$
(24
)
$
(16
)
$
(132
)
$
(137
)
Noncurrent liabilities
(13,269
)
(11,488
)
(2,446
)
(2,460
)
Total liabilities
$
(13,293
)
$
(11,504
)
$
(2,578
)
$
(2,597
)
Net actuarial loss
$
(7,958
)
$
(5,844
)
$
(473
)
$
(406
)
Prior service cost
—
—
187
(5
)
Total accumulated other comprehensive loss, pretax
$
(7,958
)
$
(5,844
)
$
(286
)
$
(411
)
Pension Benefits
Other Postretirement and
Postemployment Benefits
Year Ended December 31,
Year Ended December 31,
(in millions) 2012 2011 2010
2012 2011 2010
Service cost
$
—
$
—
$
—
$
56
$
52
$
58
Interest cost
930
969
982
164
180
196
Expected return on plan assets
(705
)
(724
)
(677
)
(77
)
(90
)
(90
)
Amortization of prior service benefit
—
—
—
(
21
)
(3
)
(4
)
Recognized net actuarial loss (gain)
143
55
48
23
(11
)
(4
)
Settlements
—
—
14
—
—
—
Special termination benefits
—
—
—
116
—
—
Net periodic cost
$
368
$
300
$
367
$
261
$
128
$
156
Defined contribution plan costs
426
377
334
—
—
—
Total cost
$
794
$
677
$
701
$
261
$
128
$
156