Delta Airlines 2012 Annual Report Download - page 49
Download and view the complete annual report
Please find page 49 of the 2012 Delta Airlines annual report below. You can navigate through the pages in the report by either clicking on the pages listed below, or by using the keyword search tool below to find specific information within the annual report.-
 1
1 -
2
-
3
-
4
-
5
-
6
-
7
-
8
-
9
-
10
-
11
-
12
-
13
-
14
-
15
-
16
-
17
-
18
-
19
-
20
-
21
-
22
-
23
-
24
-
25
-
26
-
27
-
28
-
29
-
30
-
31
-
32
-
33
-
34
-
35
-
36
-
37
-
38
-
 39
39 -
 40
40 -
 41
41 -
 42
42 -
 43
43 -
 44
44 -
 45
45 -
 46
46 -
 47
47 -
 48
48 -
 49
49 -
 50
50 -
 51
51 -
 52
52 -
 53
53 -
 54
54 -
 55
55 -
 56
56 -
 57
57 -
 58
58 -
 59
59 -
60
-
61
-
62
-
63
-
64
-
65
-
66
-
67
-
68
-
69
-
70
-
71
-
72
-
73
-
74
-
75
-
76
-
77
-
78
-
79
-
80
-
81
-
82
-
83
-
84
-
85
-
86
-
87
-
88
-
89
-
90
-
91
-
92
-
93
-
94
-
95
-
96
-
97
-
98
-
99
-
100
-
101
-
102
-
103
-
104
-
105
-
106
-
107
-
108
-
109
-
110
-
111
-
112
-
113
-
114
-
115
-
116
-
117
-
118
-
119
-
120
-
121
-
122
-
123
-
124
-
125
-
126
-
127
-
128
-
129
-
130
-
131
-
132
-
133
-
134
-
135
-
136
-
137
-
138
-
139
-
140
-
141
-
142
-
143
-
144
-
145
-
146
-
147
-
148
-
149
-
150
-
151
-
152
-
153
-
154
-
155
-
156
-
157
-
158
-
159
-
160
-
161
-
162
-
163
-
164
-
165
-
166
-
167
-
168
-
169
-
170
-
171
-
172
-
173
-
174
-
175
-
176
-
177
-
178
-
179
-
180
-
181
-
182
-
183
-
184
-
185
-
186
-
187
-
188
-
189
-
190
-
191
-
192
-
193
-
194
-
195
-
196
-
197
-
198
-
199
-
200
-
201
-
202
-
203
-
204
-
205
-
206
-
207
-
208
-
209
-
210
-
211
-
212
-
213
-
214
-
215
-
216
-
217
-
218
-
219
-
220
-
221
-
222
-
223
-
224
-
225
-
226
-
227
-
228
-
229
-
230
-
231
-
232
-
233
-
234
-
235
-
236
-
237
-
238
-
239
-
240
-
241
-
242
-
243
-
244
-
245
-
246
-
247
-
248
-
249
-
250
-
251
-
252
-
253
-
254
-
255
-
256
-
257
-
258
-
259
-
260
-
261
-
262
-
263
-
264
-
265
-
266
-
267
-
268
-
269
-
270
-
271
-
272
-
273
-
274
-
275
-
276
-
277
-
278
-
279
-
280
-
281
-
282
-
283
-
284
-
285
-
286
-
287
-
288
-
289
-
290
-
291
-
292
-
293
-
294
-
295
-
296
-
297
-
298
-
299
-
300
-
301
-
302
-
303
-
304
-
305
-
306
-
307
-
308
-
309
-
310
-
311
-
312
-
313
-
314
-
315
-
316
-
317
-
318
-
319
-
320
-
321
-
322
-
323
-
324
-
325
-
326
-
327
-
328
-
329
-
330
-
331
-
332
-
333
-
334
-
335
-
336
-
337
-
338
-
339
-
340
-
341
-
342
-
343
-
344
-
345
-
346
-
347
-
348
-
349
-
350
-
351
-
352
-
353
-
354
-
355
-
356
-
357
-
358
-
359
-
360
-
361
-
362
-
363
-
364
-
365
-
366
-
367
-
368
-
369
-
370
-
371
-
372
-
373
-
374
-
375
-
376
-
377
-
378
-
379
-
380
-
381
-
382
-
383
-
384
-
385
-
386
-
387
-
388
-
389
-
390
-
391
-
392
-
393
-
394
-
395
-
396
-
397
-
398
-
399
-
400
-
401
-
402
-
403
-
404
-
405
-
406
-
407
-
408
-
409
-
410
-
411
-
412
-
413
-
414
-
415
-
416
-
417
-
418
-
419
-
420
-
421
-
422
-
423
-
424
 |
 |

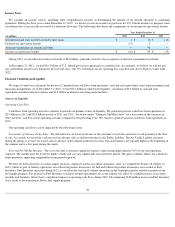
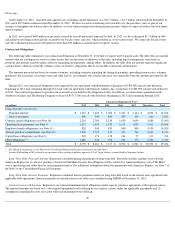
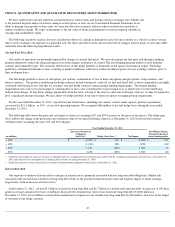
Weighted Average Discount Rate. We determine our weighted average discount rate on our measurement date primarily by reference to
annualized rates earned on high quality fixed income investments and yield-to-maturity analysis specific to our estimated future benefit payments.
We used a weighted average discount rate to value the obligations of 4.11% and 4.94% at December 31, 2012 and 2011 , respectively. Our weighted
average discount rate for net periodic pension benefit cost in each of the past three years has varied from the rate selected on our measurement date,
ranging from 4.95% to 5.93% between 2010 and 2012 .
Expected Long-Term Rate of Return. Our expected long-term rate of return on plan assets of 9% is based primarily on plan-specific investment
studies using historical market return and volatility data. Modest excess return expectations versus some public market indices are incorporated into
the return projections based on the actively managed structure of the investment programs and their records of achieving such returns historically. We
also expect to receive a premium for investing in less liquid private markets. We review our rate of return on plan asset assumptions annually. Our
annual investment performance for one particular year does not, by itself, significantly influence our evaluation. Our actual historical annualized 20-
year rate of return on plan assets for our defined benefit pension plans exceeded 9% as of December 31, 2012 . The investment strategy for our
defined benefit pension plan assets is to use a diversified mix of global public and private equity portfolios, public and private fixed income
portfolios and private real estate and natural resource investments to earn a long-term investment return that meets or exceeds our annualized return
target. Our expected long-term rate of return on assets for net periodic pension benefit cost for the year ended December 31, 2012 was 9%.
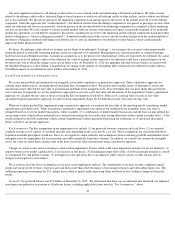
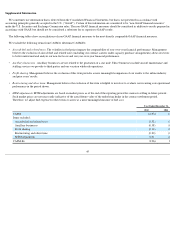
The impact of a 0.50% change in these assumptions is shown in the table below:
Funding. Our funding obligations for qualified defined benefit plans are governed by the Employee Retirement Income Security Act.
The Pension
Protection Act of 2006 allows commercial airlines to elect alternative funding rules (“Alternative Funding Rules”) for defined benefit plans that are
frozen. Delta elected the Alternative Funding Rules under which the unfunded liability for a frozen defined benefit plan may be amortized over a
fixed 17-year period and is calculated using an 8.85% interest rate.
While the Pension Protection Act makes our funding obligations for these plans more predictable, factors outside our control continue to have an
impact on the funding requirements. Estimates of future funding requirements are based on various assumptions and can vary materially from actual
funding requirements. Assumptions include, among other things, the actual and projected market performance of assets; statutory requirements; and
demographic data for participants. For additional information, see Note 11 of the Notes to the Consolidated Financial Statements.
Recent Accounting Standards
Presentation of Comprehensive Income
In June 2011, the FASB issued "Presentation of Comprehensive Income." The standard revises the presentation and prominence of the items
reported in other comprehensive income and is effective retrospectively for fiscal years beginning after December 15, 2011. We adopted this standard
in 2012 and have presented comprehensive income in our Consolidated Statements of Comprehensive Income (Loss).
44
Change in Assumption Effect on 2013
Pension Expense
Effect on Accrued
Pension Liability at
December 31, 2012
0.50% decrease in weighted average discount rate -$5 million +$1.4 billion
0.50% increase in weighted average discount rate — - $1.3 billion
0.50% decrease in expected long-term rate of return on assets +$40 million —
0.50% increase in expected long-term rate of return on assets - $40 million —