Delta Airlines 2012 Annual Report Download - page 42
Download and view the complete annual report
Please find page 42 of the 2012 Delta Airlines annual report below. You can navigate through the pages in the report by either clicking on the pages listed below, or by using the keyword search tool below to find specific information within the annual report.-
 1
1 -
2
-
3
-
4
-
5
-
6
-
7
-
8
-
9
-
10
-
11
-
12
-
13
-
14
-
15
-
16
-
17
-
18
-
19
-
20
-
21
-
22
-
23
-
24
-
25
-
26
-
27
-
28
-
29
-
30
-
31
-
 32
32 -
 33
33 -
 34
34 -
 35
35 -
 36
36 -
 37
37 -
 38
38 -
 39
39 -
 40
40 -
 41
41 -
 42
42 -
 43
43 -
 44
44 -
 45
45 -
 46
46 -
 47
47 -
 48
48 -
 49
49 -
 50
50 -
 51
51 -
 52
52 -
53
-
54
-
55
-
56
-
57
-
58
-
59
-
60
-
61
-
62
-
63
-
64
-
65
-
66
-
67
-
68
-
69
-
70
-
71
-
72
-
73
-
74
-
75
-
76
-
77
-
78
-
79
-
80
-
81
-
82
-
83
-
84
-
85
-
86
-
87
-
88
-
89
-
90
-
91
-
92
-
93
-
94
-
95
-
96
-
97
-
98
-
99
-
100
-
101
-
102
-
103
-
104
-
105
-
106
-
107
-
108
-
109
-
110
-
111
-
112
-
113
-
114
-
115
-
116
-
117
-
118
-
119
-
120
-
121
-
122
-
123
-
124
-
125
-
126
-
127
-
128
-
129
-
130
-
131
-
132
-
133
-
134
-
135
-
136
-
137
-
138
-
139
-
140
-
141
-
142
-
143
-
144
-
145
-
146
-
147
-
148
-
149
-
150
-
151
-
152
-
153
-
154
-
155
-
156
-
157
-
158
-
159
-
160
-
161
-
162
-
163
-
164
-
165
-
166
-
167
-
168
-
169
-
170
-
171
-
172
-
173
-
174
-
175
-
176
-
177
-
178
-
179
-
180
-
181
-
182
-
183
-
184
-
185
-
186
-
187
-
188
-
189
-
190
-
191
-
192
-
193
-
194
-
195
-
196
-
197
-
198
-
199
-
200
-
201
-
202
-
203
-
204
-
205
-
206
-
207
-
208
-
209
-
210
-
211
-
212
-
213
-
214
-
215
-
216
-
217
-
218
-
219
-
220
-
221
-
222
-
223
-
224
-
225
-
226
-
227
-
228
-
229
-
230
-
231
-
232
-
233
-
234
-
235
-
236
-
237
-
238
-
239
-
240
-
241
-
242
-
243
-
244
-
245
-
246
-
247
-
248
-
249
-
250
-
251
-
252
-
253
-
254
-
255
-
256
-
257
-
258
-
259
-
260
-
261
-
262
-
263
-
264
-
265
-
266
-
267
-
268
-
269
-
270
-
271
-
272
-
273
-
274
-
275
-
276
-
277
-
278
-
279
-
280
-
281
-
282
-
283
-
284
-
285
-
286
-
287
-
288
-
289
-
290
-
291
-
292
-
293
-
294
-
295
-
296
-
297
-
298
-
299
-
300
-
301
-
302
-
303
-
304
-
305
-
306
-
307
-
308
-
309
-
310
-
311
-
312
-
313
-
314
-
315
-
316
-
317
-
318
-
319
-
320
-
321
-
322
-
323
-
324
-
325
-
326
-
327
-
328
-
329
-
330
-
331
-
332
-
333
-
334
-
335
-
336
-
337
-
338
-
339
-
340
-
341
-
342
-
343
-
344
-
345
-
346
-
347
-
348
-
349
-
350
-
351
-
352
-
353
-
354
-
355
-
356
-
357
-
358
-
359
-
360
-
361
-
362
-
363
-
364
-
365
-
366
-
367
-
368
-
369
-
370
-
371
-
372
-
373
-
374
-
375
-
376
-
377
-
378
-
379
-
380
-
381
-
382
-
383
-
384
-
385
-
386
-
387
-
388
-
389
-
390
-
391
-
392
-
393
-
394
-
395
-
396
-
397
-
398
-
399
-
400
-
401
-
402
-
403
-
404
-
405
-
406
-
407
-
408
-
409
-
410
-
411
-
412
-
413
-
414
-
415
-
416
-
417
-
418
-
419
-
420
-
421
-
422
-
423
-
424
 |
 |

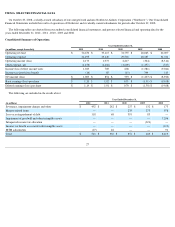
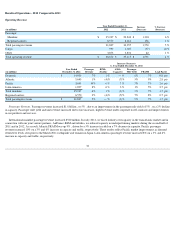
Our average price per gallon, adjusted for MTM adjustments for fuel hedges recorded in periods other than the settlement period (a non-GAAP
financial measure as defined in "Supplemental Information" below) was $3.05 for the year ended December 31, 2011 . During 2011 , our net fuel
hedge gains of $420 million included $26 million of MTM adjustments recorded in periods other than the settlement period.
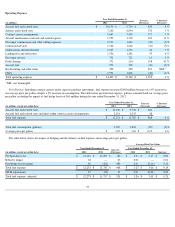
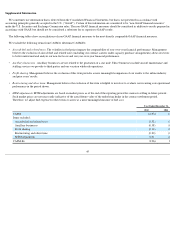
Salaries and Related Costs. Salaries and related costs increased due to a 3% average increase in headcount and employee pay increases, partially
offset by the change in reporting described above due to the transactions involving Compass and Mesaba.
Contract Carrier Arrangements . Contract carrier arrangements expense, excluding the impact of fuel expense (discussed above), increased
primarily due to the change in reporting for the transactions involving Compass and Mesaba.
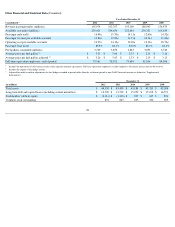
Aircraft Maintenance Materials and Outside Repairs. Aircraft maintenance materials and outside repairs expense increased primarily due to costs
associated with increased maintenance sales to third parties by our MRO services business, reflected in other revenue above.
Passenger Commissions and Other Selling Expenses. Credit card and sales commissions increased in conjunction with the 11% increase in
passenger revenue.
Aircraft Rent. Aircraft rent decreased primarily due to the restructuring of certain existing leases and the change in reporting described above due
to the transactions involving Compass and Mesaba.
Restructuring and Other Items. Due to the nature of amounts recorded within restructuring and other items, a year-over-
year comparison is not
meaningful. For a discussion of charges recorded in restructuring and other items, see Note 16 to the Notes of the Consolidated Financial Statements.
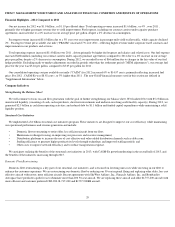
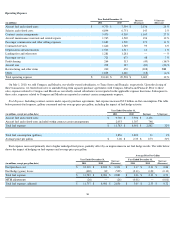
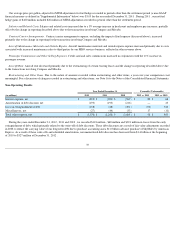
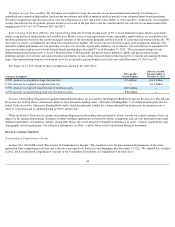
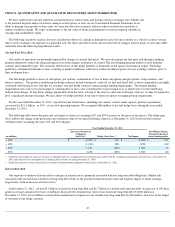
Non-Operating Results
During the years ended December 31, 2012 , 2011 and 2010 , we recorded $118 million , $68 million and $391 million in losses from the early
extinguishment of debt, which primarily related to the write-
off of debt discounts. These debt discounts are a result of fair value adjustments recorded
in 2008 to reduce the carrying value of our long-term debt due to purchase accounting and a $1.0 billion advance purchase of SkyMiles by American
Express. As a result of these write-offs and scheduled amortization, our unamortized debt discount has decreased from $1.4 billion at the beginning
of 2010 to $527 million at December 31, 2012 .
37
Year Ended December 31,
Favorable (Unfavorable)
(in millions) 2012 2011 2010
2012 vs. 2011 2011 vs. 2010
Interest expense, net
$
(812
)
$
(901
)
$
(969
)
$
89
$
68
Amortization of debt discount, net
(193
)
(193
)
(216
)
—
23
Loss on extinguishment of debt
(118
)
(68
)
(391
)
(50
)
323
Miscellaneous, net
(27
)
(44
)
(33
)
17
(11
)
Total other expense, net
$
(1,150
)
$
(1,206
)
$
(1,609
)
$
56
$
403