Delta Airlines 2012 Annual Report Download - page 67
Download and view the complete annual report
Please find page 67 of the 2012 Delta Airlines annual report below. You can navigate through the pages in the report by either clicking on the pages listed below, or by using the keyword search tool below to find specific information within the annual report.-
 1
1 -
2
-
3
-
4
-
5
-
6
-
7
-
8
-
9
-
10
-
11
-
12
-
13
-
14
-
15
-
16
-
17
-
18
-
19
-
20
-
21
-
22
-
23
-
24
-
25
-
26
-
27
-
28
-
29
-
30
-
31
-
32
-
33
-
34
-
35
-
36
-
37
-
38
-
39
-
40
-
41
-
42
-
43
-
44
-
45
-
46
-
47
-
48
-
49
-
50
-
51
-
52
-
53
-
54
-
55
-
56
-
 57
57 -
 58
58 -
 59
59 -
 60
60 -
 61
61 -
 62
62 -
 63
63 -
 64
64 -
 65
65 -
 66
66 -
 67
67 -
 68
68 -
 69
69 -
 70
70 -
 71
71 -
 72
72 -
 73
73 -
 74
74 -
 75
75 -
 76
76 -
 77
77 -
78
-
79
-
80
-
81
-
82
-
83
-
84
-
85
-
86
-
87
-
88
-
89
-
90
-
91
-
92
-
93
-
94
-
95
-
96
-
97
-
98
-
99
-
100
-
101
-
102
-
103
-
104
-
105
-
106
-
107
-
108
-
109
-
110
-
111
-
112
-
113
-
114
-
115
-
116
-
117
-
118
-
119
-
120
-
121
-
122
-
123
-
124
-
125
-
126
-
127
-
128
-
129
-
130
-
131
-
132
-
133
-
134
-
135
-
136
-
137
-
138
-
139
-
140
-
141
-
142
-
143
-
144
-
145
-
146
-
147
-
148
-
149
-
150
-
151
-
152
-
153
-
154
-
155
-
156
-
157
-
158
-
159
-
160
-
161
-
162
-
163
-
164
-
165
-
166
-
167
-
168
-
169
-
170
-
171
-
172
-
173
-
174
-
175
-
176
-
177
-
178
-
179
-
180
-
181
-
182
-
183
-
184
-
185
-
186
-
187
-
188
-
189
-
190
-
191
-
192
-
193
-
194
-
195
-
196
-
197
-
198
-
199
-
200
-
201
-
202
-
203
-
204
-
205
-
206
-
207
-
208
-
209
-
210
-
211
-
212
-
213
-
214
-
215
-
216
-
217
-
218
-
219
-
220
-
221
-
222
-
223
-
224
-
225
-
226
-
227
-
228
-
229
-
230
-
231
-
232
-
233
-
234
-
235
-
236
-
237
-
238
-
239
-
240
-
241
-
242
-
243
-
244
-
245
-
246
-
247
-
248
-
249
-
250
-
251
-
252
-
253
-
254
-
255
-
256
-
257
-
258
-
259
-
260
-
261
-
262
-
263
-
264
-
265
-
266
-
267
-
268
-
269
-
270
-
271
-
272
-
273
-
274
-
275
-
276
-
277
-
278
-
279
-
280
-
281
-
282
-
283
-
284
-
285
-
286
-
287
-
288
-
289
-
290
-
291
-
292
-
293
-
294
-
295
-
296
-
297
-
298
-
299
-
300
-
301
-
302
-
303
-
304
-
305
-
306
-
307
-
308
-
309
-
310
-
311
-
312
-
313
-
314
-
315
-
316
-
317
-
318
-
319
-
320
-
321
-
322
-
323
-
324
-
325
-
326
-
327
-
328
-
329
-
330
-
331
-
332
-
333
-
334
-
335
-
336
-
337
-
338
-
339
-
340
-
341
-
342
-
343
-
344
-
345
-
346
-
347
-
348
-
349
-
350
-
351
-
352
-
353
-
354
-
355
-
356
-
357
-
358
-
359
-
360
-
361
-
362
-
363
-
364
-
365
-
366
-
367
-
368
-
369
-
370
-
371
-
372
-
373
-
374
-
375
-
376
-
377
-
378
-
379
-
380
-
381
-
382
-
383
-
384
-
385
-
386
-
387
-
388
-
389
-
390
-
391
-
392
-
393
-
394
-
395
-
396
-
397
-
398
-
399
-
400
-
401
-
402
-
403
-
404
-
405
-
406
-
407
-
408
-
409
-
410
-
411
-
412
-
413
-
414
-
415
-
416
-
417
-
418
-
419
-
420
-
421
-
422
-
423
-
424
 |
 |

Regional Carriers Revenue
During the year ended December 31, 2012 , we had contract carrier agreements with eight Contract Carriers, in addition to our wholly-owned
subsidiary, Comair, Inc. (“Comair”). Comair ceased operations in September 2012 and merged into Delta in December 2012 (see Note 16). Our
Contract Carrier agreements are structured as either (1) capacity purchase agreements where we purchase all or a portion of the Contract Carrier's
capacity and are responsible for selling the seat inventory we purchase or (2) revenue proration agreements, which are based on a fixed dollar or
percentage division of revenues for tickets sold to passengers traveling on connecting flight itineraries. We record revenue related to all of our
Contract Carrier agreements as regional carriers passenger revenue. We record expenses related to our Contract Carrier agreements, excluding
Comair, as contract carrier arrangements expense.
Cargo Revenue
Cargo revenue is recognized when we provide the transportation.
Other Revenue
Other revenue is primarily comprised of (1) the marketing component of the sale of mileage credits discussed above, (2) baggage fee revenue, (3)
other miscellaneous service revenue, including ticket change fees and (4) revenue from ancillary businesses, such as the aircraft maintenance and
repair and staffing services we provide to third parties.
Long
-Lived Assets
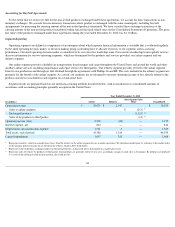
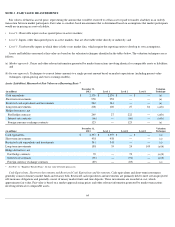
The following table shows our property and equipment:
(1)
Includes accumulated amortization for flight and ground equipment under capital leases in the amount of $653 million and $482 million at December 31, 2012 and 2011, respectively.
We record property and equipment at cost and depreciate or amortize these assets on a straight-line basis to their estimated residual values over
their estimated useful lives. The estimated useful life for leasehold improvements is the shorter of lease term or estimated useful life. Depreciation
expense for each of the years ended December 31, 2012 , 2011 and 2010 was $1.4 billion . Residual values for owned aircraft, engines, spare parts
and simulators are generally 5% to 10% of cost.
We capitalize certain internal and external costs incurred to develop and implement software, and amortize those costs over an estimated useful
life of three to seven years. For the years ended December 31, 2012 , 2011 and 2010 , we recorded $76 million , $64 million and $71 million ,
respectively, for amortization of capitalized software. The net book value of these assets totaled $344 million and $200 million at
December 31, 2012
and 2011 , respectively.
We record impairment losses on flight equipment and other long-
lived assets used in operations when events and circumstances indicate the assets
may be impaired and the estimated future cash flows generated by those assets are less than their carrying amounts. Factors which could cause
impairment include, but are not limited to, (1) a decision to permanently remove flight equipment or other long-lived assets from operations, (2)
significant changes in the estimated useful life, (3) significant changes in projected cash flows, (4) permanent and significant declines in fleet fair
values and (5) changes to the regulatory environment. For long-lived assets held for sale, we discontinue depreciation and record impairment losses
when the carrying amount of these assets is greater than the fair value less the cost to sell.
To determine whether impairments exist for aircraft used in operations, we group assets at the fleet-
type level (the lowest level for which there are
identifiable cash flows) and then estimate future cash flows based on projections of capacity, passenger mile yield, fuel costs, labor costs and other
relevant factors. If an impairment occurs, the impairment loss recognized
60
December 31,
(in millions, except for estimated useful life) Estimated Useful Life 2012 2011
Flight equipment 21-30 years
$
21,481
$
21,001
Ground property and equipment 3-40 years
4,254
3,490
Flight and ground equipment under capital leases Shorter of lease term or estimated useful life
1,381
1,127
Advance payments for equipment
253
77
Less: accumulated depreciation and amortization
(1)
(6,656
)
(5,472
)
Total property and equipment, net
$
20,713
$
20,223