Delta Airlines 2012 Annual Report Download - page 70
Download and view the complete annual report
Please find page 70 of the 2012 Delta Airlines annual report below. You can navigate through the pages in the report by either clicking on the pages listed below, or by using the keyword search tool below to find specific information within the annual report.-
 1
1 -
2
-
3
-
4
-
5
-
6
-
7
-
8
-
9
-
10
-
11
-
12
-
13
-
14
-
15
-
16
-
17
-
18
-
19
-
20
-
21
-
22
-
23
-
24
-
25
-
26
-
27
-
28
-
29
-
30
-
31
-
32
-
33
-
34
-
35
-
36
-
37
-
38
-
39
-
40
-
41
-
42
-
43
-
44
-
45
-
46
-
47
-
48
-
49
-
50
-
51
-
52
-
53
-
54
-
55
-
56
-
57
-
58
-
59
-
 60
60 -
 61
61 -
 62
62 -
 63
63 -
 64
64 -
 65
65 -
 66
66 -
 67
67 -
 68
68 -
 69
69 -
 70
70 -
 71
71 -
 72
72 -
 73
73 -
 74
74 -
 75
75 -
 76
76 -
 77
77 -
 78
78 -
 79
79 -
 80
80 -
81
-
82
-
83
-
84
-
85
-
86
-
87
-
88
-
89
-
90
-
91
-
92
-
93
-
94
-
95
-
96
-
97
-
98
-
99
-
100
-
101
-
102
-
103
-
104
-
105
-
106
-
107
-
108
-
109
-
110
-
111
-
112
-
113
-
114
-
115
-
116
-
117
-
118
-
119
-
120
-
121
-
122
-
123
-
124
-
125
-
126
-
127
-
128
-
129
-
130
-
131
-
132
-
133
-
134
-
135
-
136
-
137
-
138
-
139
-
140
-
141
-
142
-
143
-
144
-
145
-
146
-
147
-
148
-
149
-
150
-
151
-
152
-
153
-
154
-
155
-
156
-
157
-
158
-
159
-
160
-
161
-
162
-
163
-
164
-
165
-
166
-
167
-
168
-
169
-
170
-
171
-
172
-
173
-
174
-
175
-
176
-
177
-
178
-
179
-
180
-
181
-
182
-
183
-
184
-
185
-
186
-
187
-
188
-
189
-
190
-
191
-
192
-
193
-
194
-
195
-
196
-
197
-
198
-
199
-
200
-
201
-
202
-
203
-
204
-
205
-
206
-
207
-
208
-
209
-
210
-
211
-
212
-
213
-
214
-
215
-
216
-
217
-
218
-
219
-
220
-
221
-
222
-
223
-
224
-
225
-
226
-
227
-
228
-
229
-
230
-
231
-
232
-
233
-
234
-
235
-
236
-
237
-
238
-
239
-
240
-
241
-
242
-
243
-
244
-
245
-
246
-
247
-
248
-
249
-
250
-
251
-
252
-
253
-
254
-
255
-
256
-
257
-
258
-
259
-
260
-
261
-
262
-
263
-
264
-
265
-
266
-
267
-
268
-
269
-
270
-
271
-
272
-
273
-
274
-
275
-
276
-
277
-
278
-
279
-
280
-
281
-
282
-
283
-
284
-
285
-
286
-
287
-
288
-
289
-
290
-
291
-
292
-
293
-
294
-
295
-
296
-
297
-
298
-
299
-
300
-
301
-
302
-
303
-
304
-
305
-
306
-
307
-
308
-
309
-
310
-
311
-
312
-
313
-
314
-
315
-
316
-
317
-
318
-
319
-
320
-
321
-
322
-
323
-
324
-
325
-
326
-
327
-
328
-
329
-
330
-
331
-
332
-
333
-
334
-
335
-
336
-
337
-
338
-
339
-
340
-
341
-
342
-
343
-
344
-
345
-
346
-
347
-
348
-
349
-
350
-
351
-
352
-
353
-
354
-
355
-
356
-
357
-
358
-
359
-
360
-
361
-
362
-
363
-
364
-
365
-
366
-
367
-
368
-
369
-
370
-
371
-
372
-
373
-
374
-
375
-
376
-
377
-
378
-
379
-
380
-
381
-
382
-
383
-
384
-
385
-
386
-
387
-
388
-
389
-
390
-
391
-
392
-
393
-
394
-
395
-
396
-
397
-
398
-
399
-
400
-
401
-
402
-
403
-
404
-
405
-
406
-
407
-
408
-
409
-
410
-
411
-
412
-
413
-
414
-
415
-
416
-
417
-
418
-
419
-
420
-
421
-
422
-
423
-
424
 |
 |
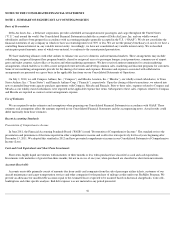
Accounting for Buy/Sell Agreements
To the extent that we receive jet fuel for the non-jet fuel products exchanged under these agreements, we account for these transactions as non-
monetary exchanges. We account for non-monetary transactions where product is exchanged with the same counterparty, including buy/sell
arrangements, by measuring the carrying amount of the non-jet fuel products transferred. We have recorded these exchange transactions at the
carrying amount of the non-
jet fuel products transferred within Aircraft fuel and related taxes on the Consolidated Statement of Operations. The gross
fair value of the products exchanged under these agreements during the year ended December 31, 2012 was $1.1 billion .
Segment Reporting
Operating segments are defined as components of an enterprise about which separate financial information is available that is evaluated regularly
by the chief operating decision maker, or decision making group, in deciding how to allocate resources to our segments and in assessing
performance. Our chief operating decision maker is considered to be our executive leadership team. Our executive leadership team regularly reviews
discrete information for our two operating segments, which are determined by the products and services provided: our airline segment and our
refinery segment.
Our airline segment provides scheduled air transportation for passengers and cargo throughout the United States and around the world and other
ancillary airline services, including maintenance and repair services for third parties. Our refinery segment provides jet fuel to the airline segment
from its own production and through jet fuel obtained through the agreements with Phillips 66 and BP. The costs included in the refinery segment are
primarily for the benefit of the airline segment. As a result, our segments are not designed to measure operating income or loss directly related to the
products and services included in each segment on a stand-alone basis.
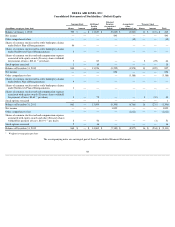
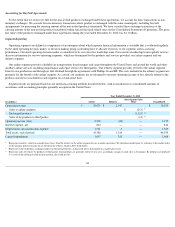
Segment results are prepared based on our internal accounting methods described below, with reconciliations to consolidated amounts in
accordance with accounting principles generally accepted in the United States:
63
Year Ended December 31, 2012
(in millions) Airline Refinery Intersegment Sales/
Other
Consolidated
Operating revenue:
$
36,670
$
1,347
$
36,670
Sales to airline segment
$
(213
)
(1)
Exchanged products
(1,121
)
(2)
Sales of by-products to third parties
(13
)
(3)
Operating income (loss)
2,238
(63
)
—
2,175
Interest expense, net
812
—
—
812
Depreciation and amortization expense
1,561
4
—
1,565
Total assets, end of period
43,386
1,164
—
44,550
Capital expenditures
1,637
331
—
1,968
(1)
Represents transfers, valued on a market price basis, from the refinery to the airline segment for use in airline operations. We determine market price by reference to the market index
for the primary delivery location for jet fuel from the refinery, which is New York harbor.
(2)
Represents value of products exchanged under our buy/sell agreements, as discussed above, determined on a market price basis.
(3)
Represents sales of refinery by-products to third parties. Such products are generally sold at or near cost; accordingly, margin on such sales is de minimis. By-
products are produced
as a result of the refining of crude oil into gasoline, diesel and jet fuel.