Delta Airlines 2012 Annual Report Download - page 395
Download and view the complete annual report
Please find page 395 of the 2012 Delta Airlines annual report below. You can navigate through the pages in the report by either clicking on the pages listed below, or by using the keyword search tool below to find specific information within the annual report.-
 1
1 -
2
-
3
-
4
-
5
-
6
-
7
-
8
-
9
-
10
-
11
-
12
-
13
-
14
-
15
-
16
-
17
-
18
-
19
-
20
-
21
-
22
-
23
-
24
-
25
-
26
-
27
-
28
-
29
-
30
-
31
-
32
-
33
-
34
-
35
-
36
-
37
-
38
-
39
-
40
-
41
-
42
-
43
-
44
-
45
-
46
-
47
-
48
-
49
-
50
-
51
-
52
-
53
-
54
-
55
-
56
-
57
-
58
-
59
-
60
-
61
-
62
-
63
-
64
-
65
-
66
-
67
-
68
-
69
-
70
-
71
-
72
-
73
-
74
-
75
-
76
-
77
-
78
-
79
-
80
-
81
-
82
-
83
-
84
-
85
-
86
-
87
-
88
-
89
-
90
-
91
-
92
-
93
-
94
-
95
-
96
-
97
-
98
-
99
-
100
-
101
-
102
-
103
-
104
-
105
-
106
-
107
-
108
-
109
-
110
-
111
-
112
-
113
-
114
-
115
-
116
-
117
-
118
-
119
-
120
-
121
-
122
-
123
-
124
-
125
-
126
-
127
-
128
-
129
-
130
-
131
-
132
-
133
-
134
-
135
-
136
-
137
-
138
-
139
-
140
-
141
-
142
-
143
-
144
-
145
-
146
-
147
-
148
-
149
-
150
-
151
-
152
-
153
-
154
-
155
-
156
-
157
-
158
-
159
-
160
-
161
-
162
-
163
-
164
-
165
-
166
-
167
-
168
-
169
-
170
-
171
-
172
-
173
-
174
-
175
-
176
-
177
-
178
-
179
-
180
-
181
-
182
-
183
-
184
-
185
-
186
-
187
-
188
-
189
-
190
-
191
-
192
-
193
-
194
-
195
-
196
-
197
-
198
-
199
-
200
-
201
-
202
-
203
-
204
-
205
-
206
-
207
-
208
-
209
-
210
-
211
-
212
-
213
-
214
-
215
-
216
-
217
-
218
-
219
-
220
-
221
-
222
-
223
-
224
-
225
-
226
-
227
-
228
-
229
-
230
-
231
-
232
-
233
-
234
-
235
-
236
-
237
-
238
-
239
-
240
-
241
-
242
-
243
-
244
-
245
-
246
-
247
-
248
-
249
-
250
-
251
-
252
-
253
-
254
-
255
-
256
-
257
-
258
-
259
-
260
-
261
-
262
-
263
-
264
-
265
-
266
-
267
-
268
-
269
-
270
-
271
-
272
-
273
-
274
-
275
-
276
-
277
-
278
-
279
-
280
-
281
-
282
-
283
-
284
-
285
-
286
-
287
-
288
-
289
-
290
-
291
-
292
-
293
-
294
-
295
-
296
-
297
-
298
-
299
-
300
-
301
-
302
-
303
-
304
-
305
-
306
-
307
-
308
-
309
-
310
-
311
-
312
-
313
-
314
-
315
-
316
-
317
-
318
-
319
-
320
-
321
-
322
-
323
-
324
-
325
-
326
-
327
-
328
-
329
-
330
-
331
-
332
-
333
-
334
-
335
-
336
-
337
-
338
-
339
-
340
-
341
-
342
-
343
-
344
-
345
-
346
-
347
-
348
-
349
-
350
-
351
-
352
-
353
-
354
-
355
-
356
-
357
-
358
-
359
-
360
-
361
-
362
-
363
-
364
-
365
-
366
-
367
-
368
-
369
-
370
-
371
-
372
-
373
-
374
-
375
-
376
-
377
-
378
-
379
-
380
-
381
-
382
-
383
-
384
-
 385
385 -
 386
386 -
 387
387 -
 388
388 -
 389
389 -
 390
390 -
 391
391 -
 392
392 -
 393
393 -
 394
394 -
 395
395 -
 396
396 -
 397
397 -
 398
398 -
 399
399 -
 400
400 -
 401
401 -
 402
402 -
 403
403 -
 404
404 -
 405
405 -
406
-
407
-
408
-
409
-
410
-
411
-
412
-
413
-
414
-
415
-
416
-
417
-
418
-
419
-
420
-
421
-
422
-
423
-
424
 |
 |

*
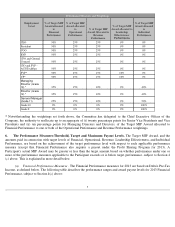
Notwithstanding the weightings set forth above, the Committee has delegated to the Chief Executive Officer of the
Company, the authority to reallocate up to an aggregate of (i) twenty percentage points for Senior Vice Presidents and Vice
Presidents and (ii) ten percentage points for Managing Directors and Directors, of the Target MIP Award allocated to
Financial Performance to one or both of the Operational Performance and Revenue Performance weightings.
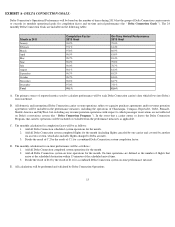
6. The Performance Measures-Threshold, Target and Maximum Payout Levels.
The Target MIP Award, and the
amounts paid in connection with target levels of Financial, Operational, Revenue, Leadership Effectiveness, and Individual
Performance, are based on the achievement of the target performance level with respect to each applicable performance
measure (except that Financial Performance also requires a payout under the Profit Sharing Program for 2013). A
Participant's actual MIP Award may be greater or less than the target amount based on whether performance under one or
more of the performance measures applicable to the Participant exceeds or is below target performance, subject to Section 4
(c) above. This is explained in more detail below.
(a) Financial Performance Measures . The Financial Performance measures for 2013 are based on Delta's Pre-
Tax
Income, as defined below. The following table describes the performance ranges and award payout levels for 2013 Financial
Performance, subject to Section 4(c) above:
3
Performance Measures and Weightings
Employment
Level
% of Target MIP
Award allocated
to
Financial
Performance
% of Target MIP
Award allocated
to
Operational
Performance
% of Target MIP
Award Allocated to
Revenue
Performance
% of Target MIP
Award allocated to
Leadership
Effectiveness
Performance
% of Target MIP
Award allocated
to
Individual
Performance
CEO 50% 25% 25% 0% 0%
President 50% 25% 25% 0% 0%
COO 50% 25% 25% 0% 0%
EVP 50% 25% 25% 0% 0%
CFO and General
Counsel 50% 25% 25% 0% 0%
CIO and SVP -
ACS/TechOps 50% 25% 25% 0% 0%
SVP* 50% 25% 15% 10% 0%
VP* 50% 25% 15% 10% 0%
Managing
Director (Grade
13) * 35% 15% 10% 0% 40%
Director (Grade
12) * 35% 15% 10% 0% 40%
General Manager
(Grade 11) 25% 15% 10% 0% 50%
Grade 10 0% 0% 0% 0% 100%
Grade 8 0% 0% 0% 0% 100%