Delta Airlines 2012 Annual Report Download - page 56
Download and view the complete annual report
Please find page 56 of the 2012 Delta Airlines annual report below. You can navigate through the pages in the report by either clicking on the pages listed below, or by using the keyword search tool below to find specific information within the annual report.-
 1
1 -
2
-
3
-
4
-
5
-
6
-
7
-
8
-
9
-
10
-
11
-
12
-
13
-
14
-
15
-
16
-
17
-
18
-
19
-
20
-
21
-
22
-
23
-
24
-
25
-
26
-
27
-
28
-
29
-
30
-
31
-
32
-
33
-
34
-
35
-
36
-
37
-
38
-
39
-
40
-
41
-
42
-
43
-
44
-
45
-
 46
46 -
 47
47 -
 48
48 -
 49
49 -
 50
50 -
 51
51 -
 52
52 -
 53
53 -
 54
54 -
 55
55 -
 56
56 -
 57
57 -
 58
58 -
 59
59 -
 60
60 -
 61
61 -
 62
62 -
 63
63 -
 64
64 -
 65
65 -
 66
66 -
67
-
68
-
69
-
70
-
71
-
72
-
73
-
74
-
75
-
76
-
77
-
78
-
79
-
80
-
81
-
82
-
83
-
84
-
85
-
86
-
87
-
88
-
89
-
90
-
91
-
92
-
93
-
94
-
95
-
96
-
97
-
98
-
99
-
100
-
101
-
102
-
103
-
104
-
105
-
106
-
107
-
108
-
109
-
110
-
111
-
112
-
113
-
114
-
115
-
116
-
117
-
118
-
119
-
120
-
121
-
122
-
123
-
124
-
125
-
126
-
127
-
128
-
129
-
130
-
131
-
132
-
133
-
134
-
135
-
136
-
137
-
138
-
139
-
140
-
141
-
142
-
143
-
144
-
145
-
146
-
147
-
148
-
149
-
150
-
151
-
152
-
153
-
154
-
155
-
156
-
157
-
158
-
159
-
160
-
161
-
162
-
163
-
164
-
165
-
166
-
167
-
168
-
169
-
170
-
171
-
172
-
173
-
174
-
175
-
176
-
177
-
178
-
179
-
180
-
181
-
182
-
183
-
184
-
185
-
186
-
187
-
188
-
189
-
190
-
191
-
192
-
193
-
194
-
195
-
196
-
197
-
198
-
199
-
200
-
201
-
202
-
203
-
204
-
205
-
206
-
207
-
208
-
209
-
210
-
211
-
212
-
213
-
214
-
215
-
216
-
217
-
218
-
219
-
220
-
221
-
222
-
223
-
224
-
225
-
226
-
227
-
228
-
229
-
230
-
231
-
232
-
233
-
234
-
235
-
236
-
237
-
238
-
239
-
240
-
241
-
242
-
243
-
244
-
245
-
246
-
247
-
248
-
249
-
250
-
251
-
252
-
253
-
254
-
255
-
256
-
257
-
258
-
259
-
260
-
261
-
262
-
263
-
264
-
265
-
266
-
267
-
268
-
269
-
270
-
271
-
272
-
273
-
274
-
275
-
276
-
277
-
278
-
279
-
280
-
281
-
282
-
283
-
284
-
285
-
286
-
287
-
288
-
289
-
290
-
291
-
292
-
293
-
294
-
295
-
296
-
297
-
298
-
299
-
300
-
301
-
302
-
303
-
304
-
305
-
306
-
307
-
308
-
309
-
310
-
311
-
312
-
313
-
314
-
315
-
316
-
317
-
318
-
319
-
320
-
321
-
322
-
323
-
324
-
325
-
326
-
327
-
328
-
329
-
330
-
331
-
332
-
333
-
334
-
335
-
336
-
337
-
338
-
339
-
340
-
341
-
342
-
343
-
344
-
345
-
346
-
347
-
348
-
349
-
350
-
351
-
352
-
353
-
354
-
355
-
356
-
357
-
358
-
359
-
360
-
361
-
362
-
363
-
364
-
365
-
366
-
367
-
368
-
369
-
370
-
371
-
372
-
373
-
374
-
375
-
376
-
377
-
378
-
379
-
380
-
381
-
382
-
383
-
384
-
385
-
386
-
387
-
388
-
389
-
390
-
391
-
392
-
393
-
394
-
395
-
396
-
397
-
398
-
399
-
400
-
401
-
402
-
403
-
404
-
405
-
406
-
407
-
408
-
409
-
410
-
411
-
412
-
413
-
414
-
415
-
416
-
417
-
418
-
419
-
420
-
421
-
422
-
423
-
424
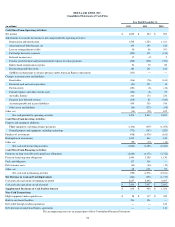
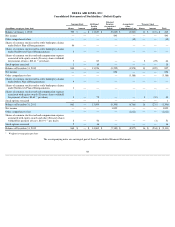
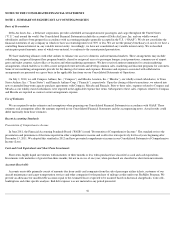
 |
 |
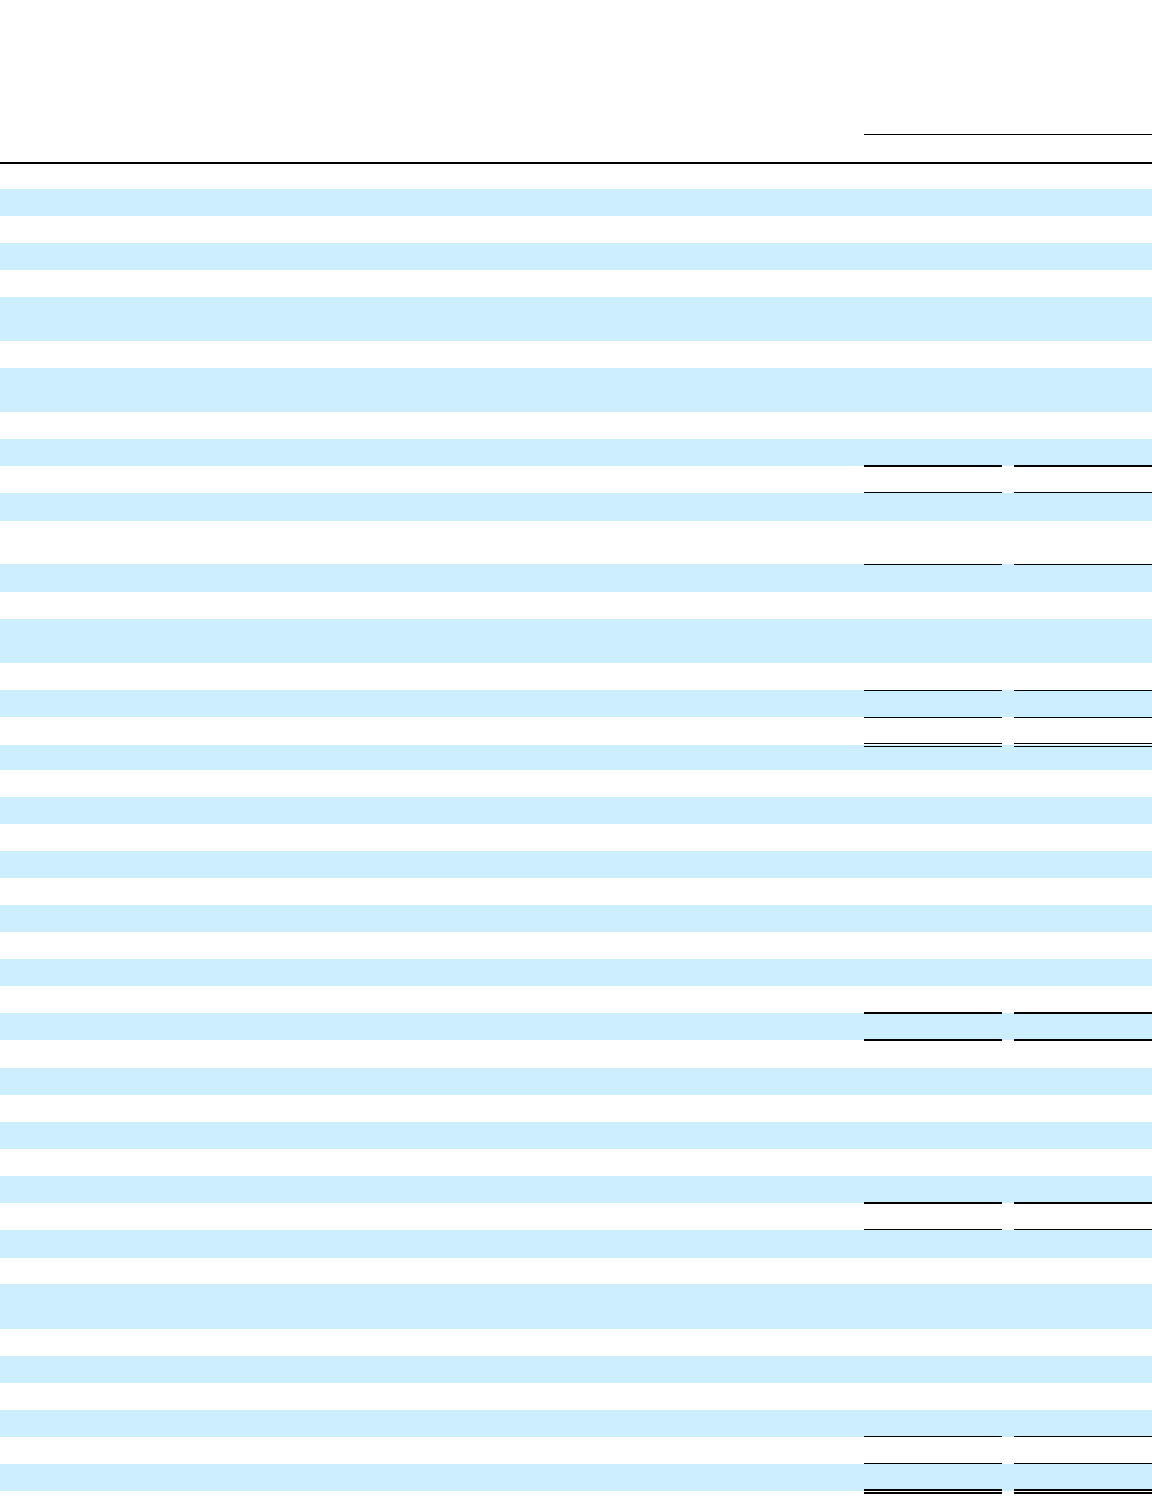
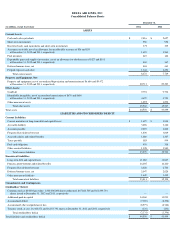
DELTA AIR LINES, INC.
Consolidated Balance Sheets
December 31,
(in millions, except share data) 2012
2011
ASSETS
Current Assets:
Cash and cash equivalents
$
2,416
$
2,657
Short-term investments
958
958
Restricted cash, cash equivalents and short-term investments
375
305
Accounts receivable, net of an allowance for uncollectible accounts of $36 and $33
at December 31, 2012 and 2011, respectively
1,693
1,563
Fuel inventory
619
168
Expendable parts and supplies inventories, net of an allowance for obsolescence of $127 and $101
at December 31, 2012 and 2011, respectively
404
367
Deferred income taxes, net
463
461
Prepaid expenses and other
1,344
1,250
Total current assets
8,272
7,729
Property and Equipment, Net:
Property and equipment, net of accumulated depreciation and amortization of $6,656 and $5,472
at December 31, 2012 and 2011, respectively
20,713
20,223
Other Assets:
Goodwill
9,794
9,794
Identifiable intangibles, net of accumulated amortization of $670 and $600
at December 31, 2012 and 2011, respectively
4,679
4,751
Other noncurrent assets
1,092
1,002
Total other assets
15,565
15,547
Total assets
$
44,550
$
43,499
LIABILITIES AND STOCKHOLDERS' DEFICIT
Current Liabilities:
Current maturities of long-term debt and capital leases
$
1,627
$
1,944
Air traffic liability
3,696
3,480
Accounts payable
2,293
1,600
Frequent flyer deferred revenue
1,806
1,849
Accrued salaries and related benefits
1,680
1,367
Taxes payable
585
594
Fuel card obligation
455
318
Other accrued liabilities
1,128
1,549
Total current liabilities
13,270
12,701
Noncurrent Liabilities:
Long-term debt and capital leases
11,082
11,847
Pension, postretirement and related benefits
16,005
14,200
Frequent flyer deferred revenue
2,628
2,700
Deferred income taxes, net
2,047
2,028
Other noncurrent liabilities
1,649
1,419
Total noncurrent liabilities
33,411
32,194
Commitments and Contingencies
Stockholders' Deficit:
Common stock at $0.0001 par value; 1,500,000,000 shares authorized, 867,866,505 and 861,499,734
shares issued at December 31, 2012 and 2011, respectively
—
—
Additional paid-in capital
14,069
13,999
Accumulated deficit
(7,389
)
(8,398
)
Accumulated other comprehensive loss
(8,577
)
(6,766
)
Treasury stock, at cost, 16,464,472 and 16,253,791 shares at December 31, 2012 and 2011, respectively
(234
)
(231
)
Total stockholders' deficit
(2,131
)
(1,396
)
Total liabilities and stockholders' deficit
$
44,550
$
43,499