Delta Airlines 2012 Annual Report Download - page 32
Download and view the complete annual report
Please find page 32 of the 2012 Delta Airlines annual report below. You can navigate through the pages in the report by either clicking on the pages listed below, or by using the keyword search tool below to find specific information within the annual report.-
 1
1 -
2
-
3
-
4
-
5
-
6
-
7
-
8
-
9
-
10
-
11
-
12
-
13
-
14
-
15
-
16
-
17
-
18
-
19
-
20
-
21
-
 22
22 -
 23
23 -
 24
24 -
 25
25 -
 26
26 -
 27
27 -
 28
28 -
 29
29 -
 30
30 -
 31
31 -
 32
32 -
 33
33 -
 34
34 -
 35
35 -
 36
36 -
 37
37 -
 38
38 -
 39
39 -
 40
40 -
 41
41 -
 42
42 -
43
-
44
-
45
-
46
-
47
-
48
-
49
-
50
-
51
-
52
-
53
-
54
-
55
-
56
-
57
-
58
-
59
-
60
-
61
-
62
-
63
-
64
-
65
-
66
-
67
-
68
-
69
-
70
-
71
-
72
-
73
-
74
-
75
-
76
-
77
-
78
-
79
-
80
-
81
-
82
-
83
-
84
-
85
-
86
-
87
-
88
-
89
-
90
-
91
-
92
-
93
-
94
-
95
-
96
-
97
-
98
-
99
-
100
-
101
-
102
-
103
-
104
-
105
-
106
-
107
-
108
-
109
-
110
-
111
-
112
-
113
-
114
-
115
-
116
-
117
-
118
-
119
-
120
-
121
-
122
-
123
-
124
-
125
-
126
-
127
-
128
-
129
-
130
-
131
-
132
-
133
-
134
-
135
-
136
-
137
-
138
-
139
-
140
-
141
-
142
-
143
-
144
-
145
-
146
-
147
-
148
-
149
-
150
-
151
-
152
-
153
-
154
-
155
-
156
-
157
-
158
-
159
-
160
-
161
-
162
-
163
-
164
-
165
-
166
-
167
-
168
-
169
-
170
-
171
-
172
-
173
-
174
-
175
-
176
-
177
-
178
-
179
-
180
-
181
-
182
-
183
-
184
-
185
-
186
-
187
-
188
-
189
-
190
-
191
-
192
-
193
-
194
-
195
-
196
-
197
-
198
-
199
-
200
-
201
-
202
-
203
-
204
-
205
-
206
-
207
-
208
-
209
-
210
-
211
-
212
-
213
-
214
-
215
-
216
-
217
-
218
-
219
-
220
-
221
-
222
-
223
-
224
-
225
-
226
-
227
-
228
-
229
-
230
-
231
-
232
-
233
-
234
-
235
-
236
-
237
-
238
-
239
-
240
-
241
-
242
-
243
-
244
-
245
-
246
-
247
-
248
-
249
-
250
-
251
-
252
-
253
-
254
-
255
-
256
-
257
-
258
-
259
-
260
-
261
-
262
-
263
-
264
-
265
-
266
-
267
-
268
-
269
-
270
-
271
-
272
-
273
-
274
-
275
-
276
-
277
-
278
-
279
-
280
-
281
-
282
-
283
-
284
-
285
-
286
-
287
-
288
-
289
-
290
-
291
-
292
-
293
-
294
-
295
-
296
-
297
-
298
-
299
-
300
-
301
-
302
-
303
-
304
-
305
-
306
-
307
-
308
-
309
-
310
-
311
-
312
-
313
-
314
-
315
-
316
-
317
-
318
-
319
-
320
-
321
-
322
-
323
-
324
-
325
-
326
-
327
-
328
-
329
-
330
-
331
-
332
-
333
-
334
-
335
-
336
-
337
-
338
-
339
-
340
-
341
-
342
-
343
-
344
-
345
-
346
-
347
-
348
-
349
-
350
-
351
-
352
-
353
-
354
-
355
-
356
-
357
-
358
-
359
-
360
-
361
-
362
-
363
-
364
-
365
-
366
-
367
-
368
-
369
-
370
-
371
-
372
-
373
-
374
-
375
-
376
-
377
-
378
-
379
-
380
-
381
-
382
-
383
-
384
-
385
-
386
-
387
-
388
-
389
-
390
-
391
-
392
-
393
-
394
-
395
-
396
-
397
-
398
-
399
-
400
-
401
-
402
-
403
-
404
-
405
-
406
-
407
-
408
-
409
-
410
-
411
-
412
-
413
-
414
-
415
-
416
-
417
-
418
-
419
-
420
-
421
-
422
-
423
-
424
 |
 |

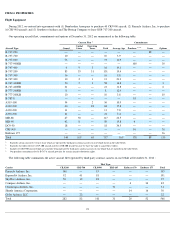
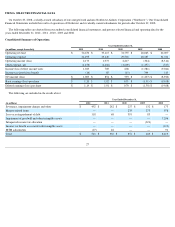
ITEM 6. SELECTED FINANCIAL DATA
On October 29, 2008, a wholly-owned subsidiary of ours merged with and into Northwest Airlines Corporation ("Northwest"). Our Consolidated
Financial Statements include the results of operations of Northwest and its wholly-owned subsidiaries for periods after October 29, 2008.
The following tables are derived from our audited consolidated financial statements, and present selected financial and operating data for the
years ended December 31, 2012 , 2011 , 2010 , 2009 and 2008 .
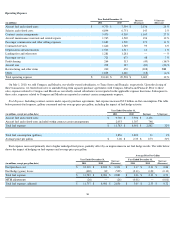
Consolidated Summary of Operations
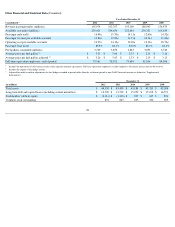
The following are included in the results above:
27
Year Ended December 31,
(in millions, except share data) 2012 2011 2010 2009 2008
Operating revenue
$
36,670
$
35,115
$
31,755
$
28,063
$
22,697
Operating expense
34,495
33,140
29,538
28,387
31,011
Operating income (loss)
2,175
1,975
2,217
(324
)
(8,314
)
Other expense, net
(1,150
)
(1,206
)
(1,609
)
(1,257
)
(727
)
Income (loss) before income taxes
1,025
769
608
(1,581
)
(9,041
)
Income tax (provision) benefit
(16
)
85
(15
)
344
119
Net income (loss)
$
1,009
$
854
$
593
$
(1,237
)
$
(8,922
)
Basic earnings (loss) per share
$
1.20
$
1.02
$
0.71
$
(1.50
)
$
(19.08
)
Diluted earnings (loss) per share
$
1.19
$
1.01
$
0.70
$
(1.50
)
$
(19.08
)
Year Ended December 31,
(in millions) 2012 2011 2010 2009 2008
Severance, impairment charges and other
$
452
$
242
$
227
$
132
$
173
Merger-related items
—
—
233
275
978
Loss on extinguishment of debt
118
68
391
83
—
Impairment of goodwill and other intangible assets
—
—
—
—
7,296
Intraperiod income tax allocation
—
—
—
(
321
)
—
Income tax benefit associated with intangible assets
—
—
—
—
(
119
)
MTM adjustments
(27
)
26
—
—
91
Total
$
543
$
336
$
851
$
169
$
8,419