Delta Airlines 2012 Annual Report Download - page 419
Download and view the complete annual report
Please find page 419 of the 2012 Delta Airlines annual report below. You can navigate through the pages in the report by either clicking on the pages listed below, or by using the keyword search tool below to find specific information within the annual report.-
 1
1 -
2
-
3
-
4
-
5
-
6
-
7
-
8
-
9
-
10
-
11
-
12
-
13
-
14
-
15
-
16
-
17
-
18
-
19
-
20
-
21
-
22
-
23
-
24
-
25
-
26
-
27
-
28
-
29
-
30
-
31
-
32
-
33
-
34
-
35
-
36
-
37
-
38
-
39
-
40
-
41
-
42
-
43
-
44
-
45
-
46
-
47
-
48
-
49
-
50
-
51
-
52
-
53
-
54
-
55
-
56
-
57
-
58
-
59
-
60
-
61
-
62
-
63
-
64
-
65
-
66
-
67
-
68
-
69
-
70
-
71
-
72
-
73
-
74
-
75
-
76
-
77
-
78
-
79
-
80
-
81
-
82
-
83
-
84
-
85
-
86
-
87
-
88
-
89
-
90
-
91
-
92
-
93
-
94
-
95
-
96
-
97
-
98
-
99
-
100
-
101
-
102
-
103
-
104
-
105
-
106
-
107
-
108
-
109
-
110
-
111
-
112
-
113
-
114
-
115
-
116
-
117
-
118
-
119
-
120
-
121
-
122
-
123
-
124
-
125
-
126
-
127
-
128
-
129
-
130
-
131
-
132
-
133
-
134
-
135
-
136
-
137
-
138
-
139
-
140
-
141
-
142
-
143
-
144
-
145
-
146
-
147
-
148
-
149
-
150
-
151
-
152
-
153
-
154
-
155
-
156
-
157
-
158
-
159
-
160
-
161
-
162
-
163
-
164
-
165
-
166
-
167
-
168
-
169
-
170
-
171
-
172
-
173
-
174
-
175
-
176
-
177
-
178
-
179
-
180
-
181
-
182
-
183
-
184
-
185
-
186
-
187
-
188
-
189
-
190
-
191
-
192
-
193
-
194
-
195
-
196
-
197
-
198
-
199
-
200
-
201
-
202
-
203
-
204
-
205
-
206
-
207
-
208
-
209
-
210
-
211
-
212
-
213
-
214
-
215
-
216
-
217
-
218
-
219
-
220
-
221
-
222
-
223
-
224
-
225
-
226
-
227
-
228
-
229
-
230
-
231
-
232
-
233
-
234
-
235
-
236
-
237
-
238
-
239
-
240
-
241
-
242
-
243
-
244
-
245
-
246
-
247
-
248
-
249
-
250
-
251
-
252
-
253
-
254
-
255
-
256
-
257
-
258
-
259
-
260
-
261
-
262
-
263
-
264
-
265
-
266
-
267
-
268
-
269
-
270
-
271
-
272
-
273
-
274
-
275
-
276
-
277
-
278
-
279
-
280
-
281
-
282
-
283
-
284
-
285
-
286
-
287
-
288
-
289
-
290
-
291
-
292
-
293
-
294
-
295
-
296
-
297
-
298
-
299
-
300
-
301
-
302
-
303
-
304
-
305
-
306
-
307
-
308
-
309
-
310
-
311
-
312
-
313
-
314
-
315
-
316
-
317
-
318
-
319
-
320
-
321
-
322
-
323
-
324
-
325
-
326
-
327
-
328
-
329
-
330
-
331
-
332
-
333
-
334
-
335
-
336
-
337
-
338
-
339
-
340
-
341
-
342
-
343
-
344
-
345
-
346
-
347
-
348
-
349
-
350
-
351
-
352
-
353
-
354
-
355
-
356
-
357
-
358
-
359
-
360
-
361
-
362
-
363
-
364
-
365
-
366
-
367
-
368
-
369
-
370
-
371
-
372
-
373
-
374
-
375
-
376
-
377
-
378
-
379
-
380
-
381
-
382
-
383
-
384
-
385
-
386
-
387
-
388
-
389
-
390
-
391
-
392
-
393
-
394
-
395
-
396
-
397
-
398
-
399
-
400
-
401
-
402
-
403
-
404
-
405
-
406
-
407
-
408
-
 409
409 -
 410
410 -
 411
411 -
 412
412 -
 413
413 -
 414
414 -
 415
415 -
 416
416 -
 417
417 -
 418
418 -
 419
419 -
 420
420 -
 421
421 -
 422
422 -
 423
423 -
 424
424
 |
 |
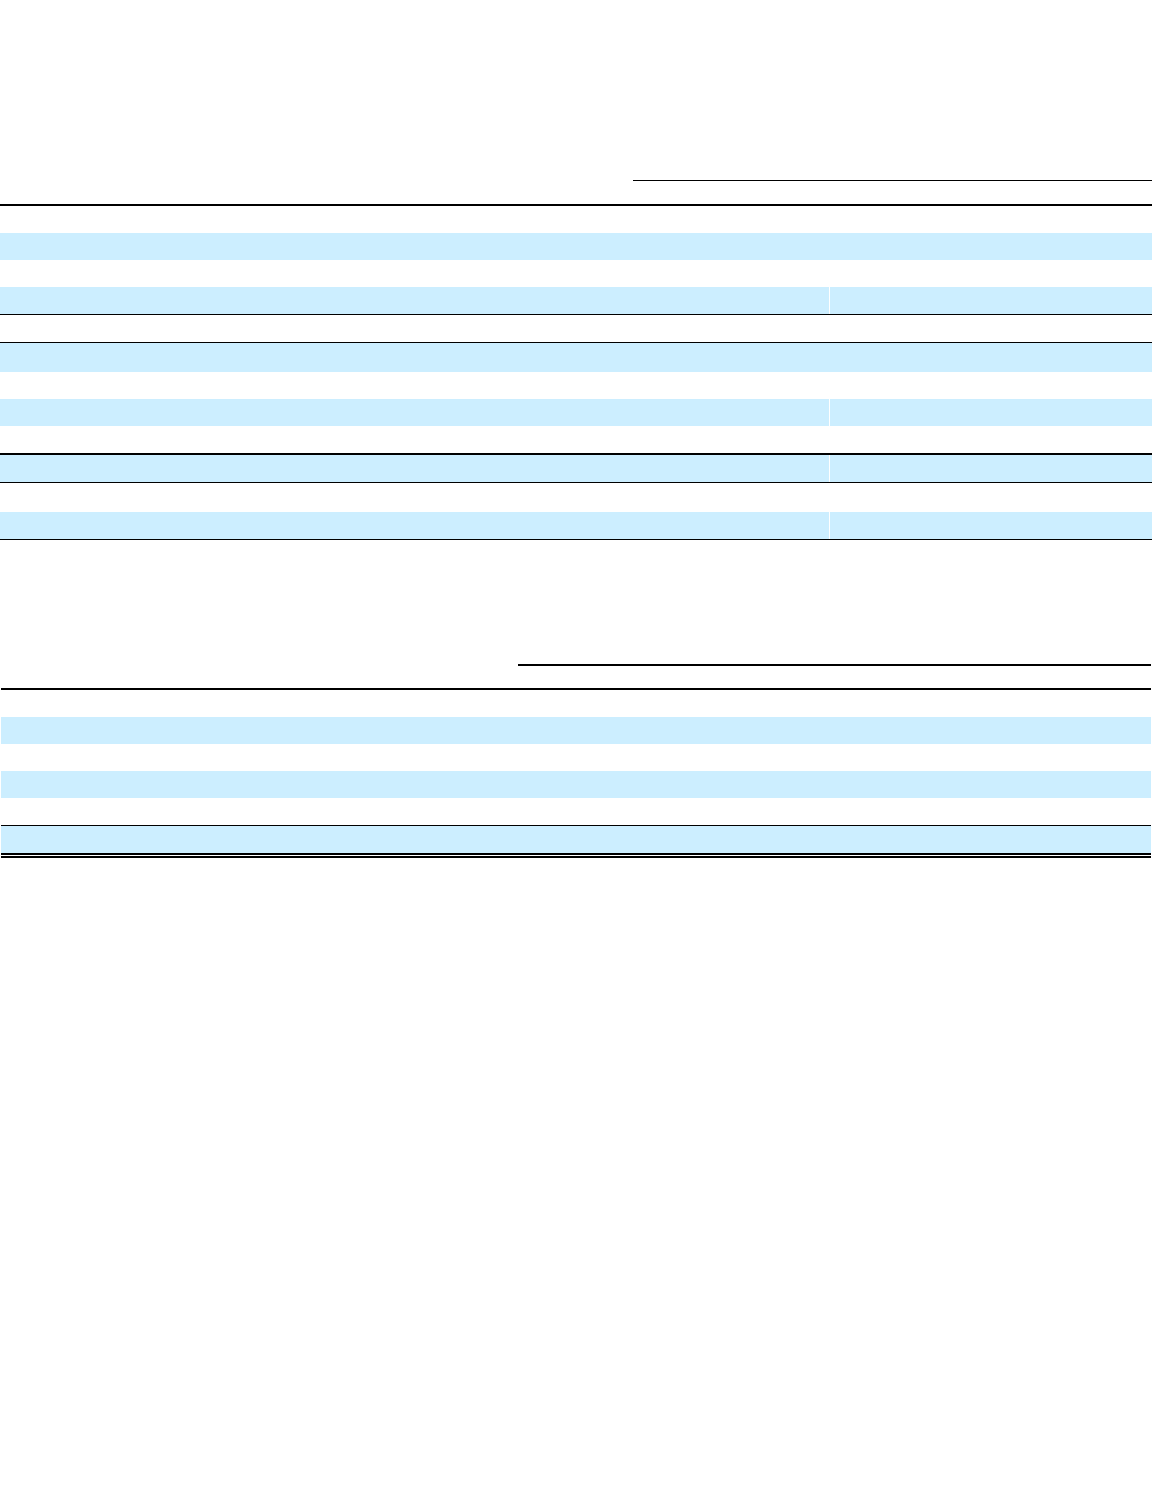
Exhibit 12.1
Delta Air Lines, Inc.
Computation of Ratio of Earnings to Fixed Charges
The following are included in the results above:
Year Ended December 31,
(in millions, except for ratio data) 2012 2011 2010 2009 2008
Earnings (loss) before income taxes
$
1,025
$
769
$
608
$
(1,581
)
$
(9,041
)
Add (deduct):
Fixed charges from below
1,116
1,202
1,315
1,416
805
Capitalized interest
(21
)
(9
)
(6
)
(12
)
(23
)
Earnings (loss) as adjusted
$
2,120
$
1,962
$
1,917
$
(177
)
$
(8,259
)
Fixed charges:
Interest expense, including capitalized amounts and amortization of debt costs
$
1,044
$
1,122
$
1,226
$
1,290
$
728
Portion of rental expense representative of the interest factor
72
80
89
126
77
Fixed charges
$
1,116
$
1,202
$
1,315
$
1,416
$
805
Ratio of earnings to fixed charges
(1)
1.90
1.63
1.46
(0.13
)
(10.26
)
(1)
For the years ended December 31, 2009 and 2008, earnings were not sufficient to cover fixed charges by $1.6 billion and $9.1 billion, respectively.
Year Ended December 31,
(in millions) 2012 2011 2010 2009 2008
Severance, impairment charges and other
$
452
$
242
$
227
$
132
$
173
Merger-related items
—
—
233
275
978
Loss on extinguishment of debt
118
68
391
83
—
Impairment of goodwill and other intangible assets
—
—
—
—
7,296
MTM adjustments
(27
)
26
—
—
91
Total
$
543
$
336
$
851
$
490
$
8,538