Delta Airlines 2012 Annual Report Download - page 38
Download and view the complete annual report
Please find page 38 of the 2012 Delta Airlines annual report below. You can navigate through the pages in the report by either clicking on the pages listed below, or by using the keyword search tool below to find specific information within the annual report.-
 1
1 -
2
-
3
-
4
-
5
-
6
-
7
-
8
-
9
-
10
-
11
-
12
-
13
-
14
-
15
-
16
-
17
-
18
-
19
-
20
-
21
-
22
-
23
-
24
-
25
-
26
-
27
-
 28
28 -
 29
29 -
 30
30 -
 31
31 -
 32
32 -
 33
33 -
 34
34 -
 35
35 -
 36
36 -
 37
37 -
 38
38 -
 39
39 -
 40
40 -
 41
41 -
 42
42 -
 43
43 -
 44
44 -
 45
45 -
 46
46 -
 47
47 -
 48
48 -
49
-
50
-
51
-
52
-
53
-
54
-
55
-
56
-
57
-
58
-
59
-
60
-
61
-
62
-
63
-
64
-
65
-
66
-
67
-
68
-
69
-
70
-
71
-
72
-
73
-
74
-
75
-
76
-
77
-
78
-
79
-
80
-
81
-
82
-
83
-
84
-
85
-
86
-
87
-
88
-
89
-
90
-
91
-
92
-
93
-
94
-
95
-
96
-
97
-
98
-
99
-
100
-
101
-
102
-
103
-
104
-
105
-
106
-
107
-
108
-
109
-
110
-
111
-
112
-
113
-
114
-
115
-
116
-
117
-
118
-
119
-
120
-
121
-
122
-
123
-
124
-
125
-
126
-
127
-
128
-
129
-
130
-
131
-
132
-
133
-
134
-
135
-
136
-
137
-
138
-
139
-
140
-
141
-
142
-
143
-
144
-
145
-
146
-
147
-
148
-
149
-
150
-
151
-
152
-
153
-
154
-
155
-
156
-
157
-
158
-
159
-
160
-
161
-
162
-
163
-
164
-
165
-
166
-
167
-
168
-
169
-
170
-
171
-
172
-
173
-
174
-
175
-
176
-
177
-
178
-
179
-
180
-
181
-
182
-
183
-
184
-
185
-
186
-
187
-
188
-
189
-
190
-
191
-
192
-
193
-
194
-
195
-
196
-
197
-
198
-
199
-
200
-
201
-
202
-
203
-
204
-
205
-
206
-
207
-
208
-
209
-
210
-
211
-
212
-
213
-
214
-
215
-
216
-
217
-
218
-
219
-
220
-
221
-
222
-
223
-
224
-
225
-
226
-
227
-
228
-
229
-
230
-
231
-
232
-
233
-
234
-
235
-
236
-
237
-
238
-
239
-
240
-
241
-
242
-
243
-
244
-
245
-
246
-
247
-
248
-
249
-
250
-
251
-
252
-
253
-
254
-
255
-
256
-
257
-
258
-
259
-
260
-
261
-
262
-
263
-
264
-
265
-
266
-
267
-
268
-
269
-
270
-
271
-
272
-
273
-
274
-
275
-
276
-
277
-
278
-
279
-
280
-
281
-
282
-
283
-
284
-
285
-
286
-
287
-
288
-
289
-
290
-
291
-
292
-
293
-
294
-
295
-
296
-
297
-
298
-
299
-
300
-
301
-
302
-
303
-
304
-
305
-
306
-
307
-
308
-
309
-
310
-
311
-
312
-
313
-
314
-
315
-
316
-
317
-
318
-
319
-
320
-
321
-
322
-
323
-
324
-
325
-
326
-
327
-
328
-
329
-
330
-
331
-
332
-
333
-
334
-
335
-
336
-
337
-
338
-
339
-
340
-
341
-
342
-
343
-
344
-
345
-
346
-
347
-
348
-
349
-
350
-
351
-
352
-
353
-
354
-
355
-
356
-
357
-
358
-
359
-
360
-
361
-
362
-
363
-
364
-
365
-
366
-
367
-
368
-
369
-
370
-
371
-
372
-
373
-
374
-
375
-
376
-
377
-
378
-
379
-
380
-
381
-
382
-
383
-
384
-
385
-
386
-
387
-
388
-
389
-
390
-
391
-
392
-
393
-
394
-
395
-
396
-
397
-
398
-
399
-
400
-
401
-
402
-
403
-
404
-
405
-
406
-
407
-
408
-
409
-
410
-
411
-
412
-
413
-
414
-
415
-
416
-
417
-
418
-
419
-
420
-
421
-
422
-
423
-
424
 |
 |
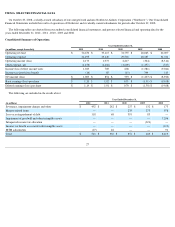
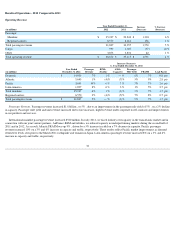
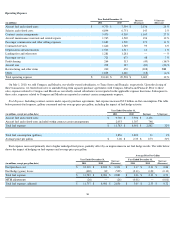
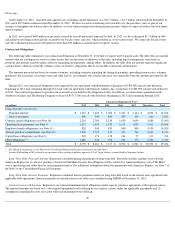
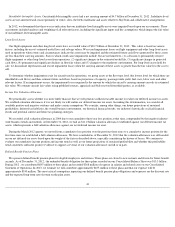
Operating Expense
(1)
NM - not meaningful
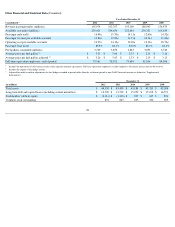
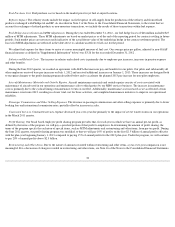
Fuel Expense. Including contract carriers under capacity purchase agreements, fuel expense increased $468 million because of a 6% increase in
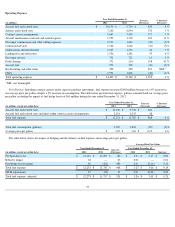
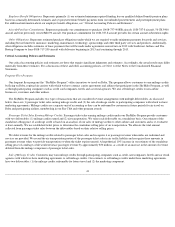
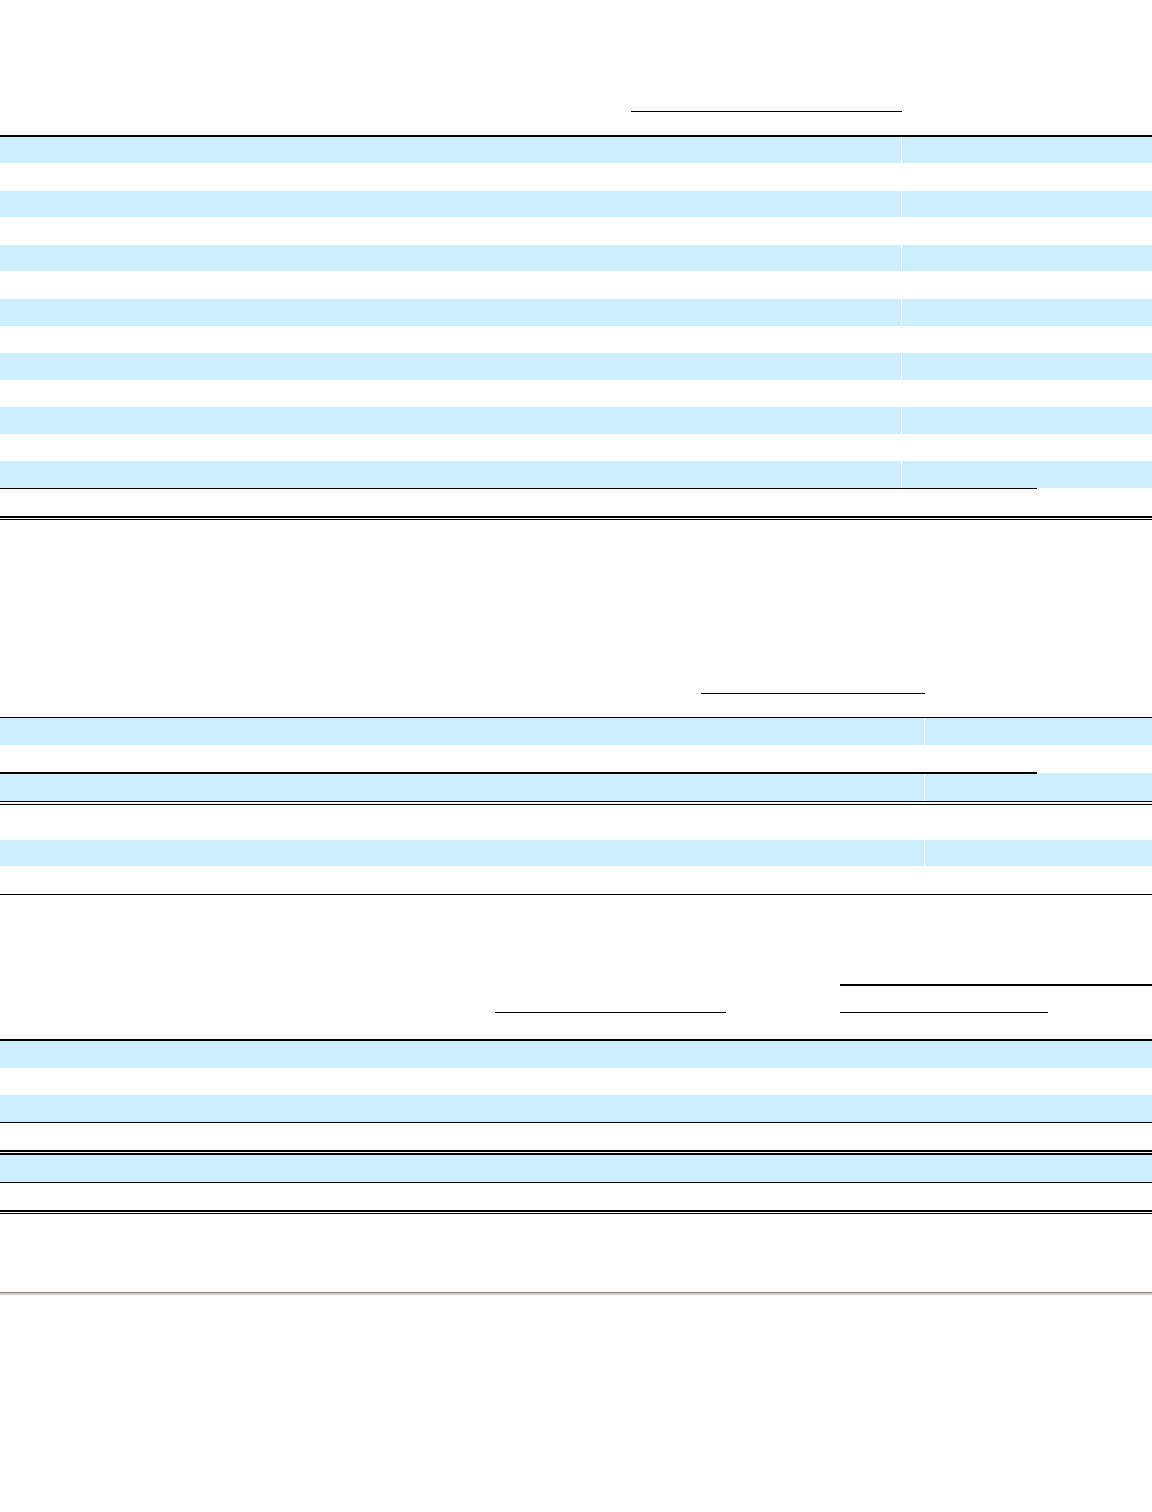
our average price per gallon, despite a 2% decrease in consumption. The table below presents fuel expense, gallons consumed and our average price
per gallon, including the impact of fuel hedge losses of $66 million during the year ended December 31, 2012 :
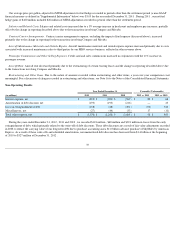
The table below shows the impact of hedging and the refinery on fuel expense and average price per gallon:
33
Year Ended December 31, Increase
(Decrease) % Increase
(Decrease) (in millions) 2012 2011
Aircraft fuel and related taxes
$
10,150
$
9,730
$
420
4
%
Salaries and related costs
7,266
6,894
372
5
%
Contract carrier arrangements
5,647
5,470
177
3
%
Aircraft maintenance materials and outside repairs
1,955
1,765
190
11
%
Passenger commissions and other selling expenses
1,590
1,682
(92
)
(5
)%
Contracted services
1,566
1,642
(76
)
(5
)%
Depreciation and amortization
1,565
1,523
42
3
%
Landing fees and other rents
1,336
1,281
55
4
%
Passenger service
732
721
11
2
%
Profit sharing
372
264
108
41
%
Aircraft rent
272
298
(26
)
(9
)%
Restructuring and other items
452
242
210
NM
(1)
Other
1,592
1,628
(36
)
(2
)%
Total operating expense
$
34,495
$
33,140
$
1,355
4
%
Year Ended December 31, Increase
(Decrease) % Increase
(Decrease) (in millions, except per gallon data) 2012 2011
Aircraft fuel and related taxes
$
10,150
$
9,730
$
420
Aircraft fuel and related taxes included within contract carrier arrangements
2,101
2,053
48
Total fuel expense
$
12,251
$
11,783
$
468
4
%
Total fuel consumption (gallons)
3,769
3,856
(87
)
(2
)%
Average price per gallon
$
3.25
$
3.06
$
0.19
6
%
Average Price Per Gallon
Year Ended December 31, Increase
(Decrease)
Year Ended December 31,
Increase (in millions, except per gallon data) 2012 2011
2012 2011
Fuel purchase cost
$
12,122
$
12,203
$
(81
)
$
3.23
$
3.17
$
0.06
Refinery impact
63
—
63
0.01
—
0.01
Fuel hedge losses (gains)
66
(420
)
486
0.01
(0.11
)
0.12
Total fuel expense
$
12,251
$
11,783
$
468
$
3.25
$
3.06
$
0.19
MTM adjustments
27
(26
)
53
0.01
(0.01
)
0.02
Total fuel expense, adjusted
$
12,278
$
11,757
$
521
$
3.26
$
3.05
$
0.21