Delta Airlines 2004 Annual Report Download - page 95
Download and view the complete annual report
Please find page 95 of the 2004 Delta Airlines annual report below. You can navigate through the pages in the report by either clicking on the pages listed below, or by using the keyword search tool below to find specific information within the annual report.-
 1
1 -
2
-
3
-
4
-
5
-
6
-
7
-
8
-
9
-
10
-
11
-
12
-
13
-
14
-
15
-
16
-
17
-
18
-
19
-
20
-
21
-
22
-
23
-
24
-
25
-
26
-
27
-
28
-
29
-
30
-
31
-
32
-
33
-
34
-
35
-
36
-
37
-
38
-
39
-
40
-
41
-
42
-
43
-
44
-
45
-
46
-
47
-
48
-
49
-
50
-
51
-
52
-
53
-
54
-
55
-
56
-
57
-
58
-
59
-
60
-
61
-
62
-
63
-
64
-
65
-
66
-
67
-
68
-
69
-
70
-
71
-
72
-
73
-
74
-
75
-
76
-
77
-
78
-
79
-
80
-
81
-
82
-
83
-
84
-
 85
85 -
 86
86 -
 87
87 -
 88
88 -
 89
89 -
 90
90 -
 91
91 -
 92
92 -
 93
93 -
 94
94 -
 95
95 -
 96
96 -
 97
97 -
 98
98 -
 99
99 -
 100
100 -
 101
101 -
 102
102 -
 103
103 -
 104
104 -
 105
105 -
106
-
107
-
108
-
109
-
110
-
111
-
112
-
113
-
114
-
115
-
116
-
117
-
118
-
119
-
120
-
121
-
122
-
123
-
124
-
125
-
126
-
127
-
128
-
129
-
130
-
131
-
132
-
133
-
134
-
135
-
136
-
137
 |
 |
Table of Contents
NOTES TO THE CONSOLIDATED FINANCIAL STATEMENTS — (Continued)
costs and lower than anticipated domestic passenger mile yields, which caused our actual and anticipated financial performance for 2004 to be significantly
worse than we originally projected. Accordingly, during the year ended December 31, 2004, we recorded an additional valuation allowance against our
deferred income tax assets, which resulted in a $1.2 billion income tax provision on our 2004 Consolidated Statement of Operations. Until we determine that
it is more likely than not that we will generate sufficient taxable income to realize our deferred income tax assets, income tax benefits associated with current
period losses will be fully reserved.
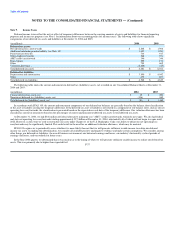
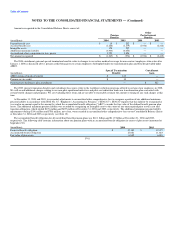
Our income tax (provision) benefit for the years ended December 31, 2004, 2003 and 2002 consisted of:
(in millions) 2004 2003 2002
Current tax benefit $ — $ — $ 319
Deferred tax benefit (exclusive of the other components listed below) 1,139 420 407
Increase in valuation allowance (2,345) (9) —
Tax benefit of dividends on allocated Series B ESOP Convertible Preferred Stock — 5 4
Income tax (provision) benefit $ (1,206) $ 416 $ 730
The following table presents the principal reasons for the difference between our effective income tax rate and the U.S. federal statutory income tax rate
for the years ended December 31, 2004, 2003 and 2002:
2004 2003 2002
U.S. federal statutory income tax rate (35.0)% (35.0)% (35.0)%
State taxes, net of federal income tax effect (1.5) (2.1) (2.4)
Meals and entertainment 0.3 1.1 0.7
Goodwill impairment 7.5 — —
Increase in valuation allowance 58.8 0.8 —
Other, net 0.1 0.2 0.2
Effective income tax rate 30.2% (35.0)% (36.5)%
Note 10. Employee Benefit Plans
We sponsor qualified and non-qualified defined benefit pension plans, defined contribution pension plans, healthcare plans, and disability and
survivorship plans for eligible employees and retirees, and their eligible family members. We reserve the right to modify or terminate these plans as to all
participants and beneficiaries at any time, except as restricted by the Internal Revenue Code, the Employee Retirement Income Security Act ("ERISA") and
our collective bargaining agreements.
Our qualified defined benefit pension plans meet or exceed ERISA's minimum funding requirements as of December 31, 2004. Our non-qualified plans
are funded primarily with current assets.
We regularly evaluate ways to better manage employee benefits and control costs. Any changes to the plans or assumptions used to estimate future
benefits could have a significant effect on the amount of the reported obligation and future annual expense.
Pension and Other Postretirement Benefit Plans
We sponsor both funded and nonfunded noncontributory defined benefit pension plans that cover substantially all of our employees. We use a
September 30 measurement date for all our benefit plans.
Effective July 1, 2003, the existing pension plan for employees not covered by a collective bargaining agreement ("non-contract employees") was
converted from a benefit based on years of service and final average salary to a cash balance benefit with a seven year transition period. During the transition
period, eligible non-contract employees receive the greater of the old final average salary benefit or the new cash balance benefit. Generally, the cash balance
benefit formula provides for an annual pay credit of 6% of eligible pay plus accrued
F-38