Delta Airlines 2004 Annual Report Download - page 37
Download and view the complete annual report
Please find page 37 of the 2004 Delta Airlines annual report below. You can navigate through the pages in the report by either clicking on the pages listed below, or by using the keyword search tool below to find specific information within the annual report.-
 1
1 -
2
-
3
-
4
-
5
-
6
-
7
-
8
-
9
-
10
-
11
-
12
-
13
-
14
-
15
-
16
-
17
-
18
-
19
-
20
-
21
-
22
-
23
-
24
-
25
-
26
-
 27
27 -
 28
28 -
 29
29 -
 30
30 -
 31
31 -
 32
32 -
 33
33 -
 34
34 -
 35
35 -
 36
36 -
 37
37 -
 38
38 -
 39
39 -
 40
40 -
 41
41 -
 42
42 -
 43
43 -
 44
44 -
 45
45 -
 46
46 -
 47
47 -
48
-
49
-
50
-
51
-
52
-
53
-
54
-
55
-
56
-
57
-
58
-
59
-
60
-
61
-
62
-
63
-
64
-
65
-
66
-
67
-
68
-
69
-
70
-
71
-
72
-
73
-
74
-
75
-
76
-
77
-
78
-
79
-
80
-
81
-
82
-
83
-
84
-
85
-
86
-
87
-
88
-
89
-
90
-
91
-
92
-
93
-
94
-
95
-
96
-
97
-
98
-
99
-
100
-
101
-
102
-
103
-
104
-
105
-
106
-
107
-
108
-
109
-
110
-
111
-
112
-
113
-
114
-
115
-
116
-
117
-
118
-
119
-
120
-
121
-
122
-
123
-
124
-
125
-
126
-
127
-
128
-
129
-
130
-
131
-
132
-
133
-
134
-
135
-
136
-
137
 |
 |

Table of Contents
2003. These adjustments related to our equity warrants and other similar rights in certain companies and to derivative instruments used in
our fuel hedging program. For additional information about SFAS 133, see Note 4 of the Notes to the Consolidated Financial Statements.
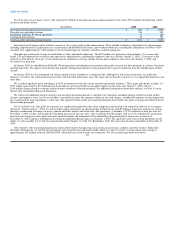
• Gain (loss) on extinguishment of debt, net was $9 million for 2004 compared to zero in 2003. During 2004, we recorded a gain due to the
exchange of certain of our unsecured 7.7% Notes due 2005 for newly issued unsecured 8.0% Senior Notes due in December 2007. During
2003, we recorded a $15 million loss from our purchase of a portion of the Delta Family-Care Savings Plan's Series C Guaranteed Serial
ESOP Notes ("ESOP Notes"), offset by a $15 million gain related to a debt exchange. For additional information about these transactions,
see Note 6 of the Notes to the Consolidated Financial Statements.
Income Tax Provision (Benefit)
During 2004, we recorded an additional valuation allowance against our net deferred income tax assets, which resulted in a $1.2 billion non-cash charge to
income tax expense on our Consolidated Statement of Operations. For additional information about the income tax valuation allowance, see Note 9 of the
Notes to the Consolidated Financial Statements.
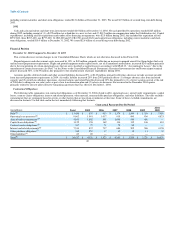
Results of Operations — 2003 Compared to 2002
Net Loss and Loss per Share
We recorded a consolidated net loss of $773 million ($6.40 diluted loss per share) in 2003, compared to a consolidated net loss of $1.3 billion ($10.44
diluted loss per share) in 2002.
Operating Revenues
Operating revenues increased 2% to $14.1 billion in 2003 compared to 2002. Passenger revenues increased 2% to $13.0 billion. RPMs decreased 2% on a
capacity decline of 4%, while passenger mile yield increased 4% to 12.73¢. For information about the factors negatively impacting the revenue environment,
see the "Business Environment" section above. During 2003, the revenue environment was also negatively impacted by the military action in Iraq.
North American Passenger Revenues. North American passenger revenues increased 2% to $10.7 billion in 2003. RPMs increased 1% on a capacity
decrease of 2%, while passenger mile yield increased 1%. Load factors increased by 1.6 points.
International Passenger Revenues. International passenger revenues decreased 4% to $2.2 billion in 2003. RPMs fell 12% on a capacity decline of 14%,
while passenger mile yield increased 9%. The decline in international revenue passenger miles, particularly in the Atlantic region, is due to the reduction in
traffic in the period leading up to and during the military action in Iraq in 2003. The increase in passenger mile yield primarily relates to the reduction of
capacity in certain markets and favorable foreign currency exchange rates.
Cargo and Other Revenues. Cargo revenues increased 2% to $467 million in 2003. Cargo ton miles decreased 6% due to reductions in capacity, while
cargo ton mile yield increased 8%. Other revenues decreased 2% to $598 million, primarily reflecting decreases due to lower revenue from certain mileage
partnership arrangements as well as a decline in codeshare revenue. These decreases were partially offset by an increase in various miscellaneous revenues.
Operating Expenses
Operating expenses totaled $14.9 billion for 2003, decreasing 2% from 2002. Operating capacity decreased 4% to 140 billion ASMs primarily due to
capacity reductions implemented as a result of the military action in Iraq. We restored most of this capacity when passenger demand improved after the end of
major military combat in Iraq in May 2003. CASM rose 2% to 10.66¢. Operating expenses and CASM reflect (1) Appropriations Act reimbursements
received during 2003; (2) restructuring, asset writedowns, pension settlements and related items, net recorded during 2003 and 2002; and (3) Stabilization Act
compensation recorded in 2002. These items are discussed below. 33