Delta Airlines 2004 Annual Report Download - page 100
Download and view the complete annual report
Please find page 100 of the 2004 Delta Airlines annual report below. You can navigate through the pages in the report by either clicking on the pages listed below, or by using the keyword search tool below to find specific information within the annual report.-
 1
1 -
2
-
3
-
4
-
5
-
6
-
7
-
8
-
9
-
10
-
11
-
12
-
13
-
14
-
15
-
16
-
17
-
18
-
19
-
20
-
21
-
22
-
23
-
24
-
25
-
26
-
27
-
28
-
29
-
30
-
31
-
32
-
33
-
34
-
35
-
36
-
37
-
38
-
39
-
40
-
41
-
42
-
43
-
44
-
45
-
46
-
47
-
48
-
49
-
50
-
51
-
52
-
53
-
54
-
55
-
56
-
57
-
58
-
59
-
60
-
61
-
62
-
63
-
64
-
65
-
66
-
67
-
68
-
69
-
70
-
71
-
72
-
73
-
74
-
75
-
76
-
77
-
78
-
79
-
80
-
81
-
82
-
83
-
84
-
85
-
86
-
87
-
88
-
89
-
 90
90 -
 91
91 -
 92
92 -
 93
93 -
 94
94 -
 95
95 -
 96
96 -
 97
97 -
 98
98 -
 99
99 -
 100
100 -
 101
101 -
 102
102 -
 103
103 -
 104
104 -
 105
105 -
 106
106 -
 107
107 -
 108
108 -
 109
109 -
 110
110 -
111
-
112
-
113
-
114
-
115
-
116
-
117
-
118
-
119
-
120
-
121
-
122
-
123
-
124
-
125
-
126
-
127
-
128
-
129
-
130
-
131
-
132
-
133
-
134
-
135
-
136
-
137
 |
 |

Table of Contents
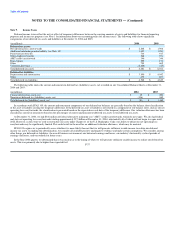
NOTES TO THE CONSOLIDATED FINANCIAL STATEMENTS — (Continued)
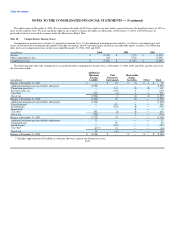
(2) Our 2004 assumptions reflect our quarterly remeasurements (December 31, 2003, March 31, 2004, and June 30, 2004) of certain portions of our
obligations and represent the weighted average of the assumptions used for each measurement. Our 2003 assumptions reflect our October 31, 2002
remeasurement of a portion of our obligations and represent the weighted average of the September 30, 2002 and October 31, 2002 assumptions.
The expected long-term rate of return on our plan assets was based on plan-specific asset/liability investment studies performed by outside consultants who
used historical market return and volatility data with forward looking estimates based on existing financial market conditions and forecasts. Modest excess
return expectations versus some market indices were incorporated into the return projections based on the actively managed structure of our investment
program and its record of achieving such returns historically.
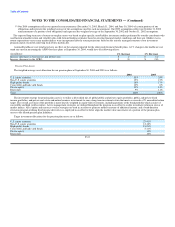
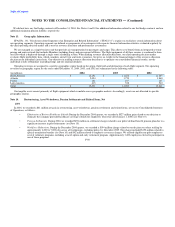
Assumed healthcare cost trend rates have an effect on the amounts reported for the other postretirement benefit plans. A 1% change in the healthcare cost
trend rate used in measuring the APBO for these plans at September 30, 2004, would have the following effects:
(in millions) 1% Increase 1% Decrease
Increase (decrease) in total service and interest cost $ 2 $ (2)
Increase (decrease) in the APBO $ 33 $ (30)
Pension Plan Assets
The weighted-average asset allocation for our pension plans at September 30, 2004 and 2003 is as follows:
2004 2003
U.S. equity securities 35% 35%
Non-U.S. equity securities 15% 15%
High quality bonds 18% 17%
Convertible and high yield bonds 10% 8%
Private equity 13% 14%
Real estate 9% 11%
Total 100% 100%
The investment strategy for pension plan assets is to utilize a diversified mix of global public and private equity portfolios, public and private fixed
income portfolios, and private real estate and natural resource investments to earn a long-term investment return that meets or exceeds a 9% annualized return
target. The overall asset mix of the portfolio is more heavily weighted in equity-like investments, including portions of the bond portfolio which consist of
convertible and high yield securities. Active management strategies are utilized throughout the program in an effort to realize investment returns in excess of
market indices. Also, option and currency overlay strategies are used in an effort to generate modest amounts of additional income, and a bond duration
extension program utilizing fixed income derivatives is employed in an effort to better align the market value movements of a portion of the pension plan
assets to the related pension plan liabilities.
Target investment allocations for the pension plan assets are as follows:
U.S. equity securities 27-41%
Non-U.S. equity securities 12-18%
High quality bonds 15-21%
Convertible and high yield bonds 5-11%
Private equity 15%
Real estate 10%
F-43