Delta Airlines 2004 Annual Report Download - page 28
Download and view the complete annual report
Please find page 28 of the 2004 Delta Airlines annual report below. You can navigate through the pages in the report by either clicking on the pages listed below, or by using the keyword search tool below to find specific information within the annual report.-
 1
1 -
2
-
3
-
4
-
5
-
6
-
7
-
8
-
9
-
10
-
11
-
12
-
13
-
14
-
15
-
16
-
17
-
 18
18 -
 19
19 -
 20
20 -
 21
21 -
 22
22 -
 23
23 -
 24
24 -
 25
25 -
 26
26 -
 27
27 -
 28
28 -
 29
29 -
 30
30 -
 31
31 -
 32
32 -
 33
33 -
 34
34 -
 35
35 -
 36
36 -
 37
37 -
 38
38 -
39
-
40
-
41
-
42
-
43
-
44
-
45
-
46
-
47
-
48
-
49
-
50
-
51
-
52
-
53
-
54
-
55
-
56
-
57
-
58
-
59
-
60
-
61
-
62
-
63
-
64
-
65
-
66
-
67
-
68
-
69
-
70
-
71
-
72
-
73
-
74
-
75
-
76
-
77
-
78
-
79
-
80
-
81
-
82
-
83
-
84
-
85
-
86
-
87
-
88
-
89
-
90
-
91
-
92
-
93
-
94
-
95
-
96
-
97
-
98
-
99
-
100
-
101
-
102
-
103
-
104
-
105
-
106
-
107
-
108
-
109
-
110
-
111
-
112
-
113
-
114
-
115
-
116
-
117
-
118
-
119
-
120
-
121
-
122
-
123
-
124
-
125
-
126
-
127
-
128
-
129
-
130
-
131
-
132
-
133
-
134
-
135
-
136
-
137
 |
 |

Table of Contents
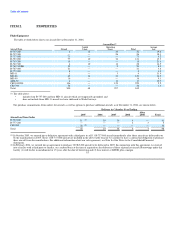
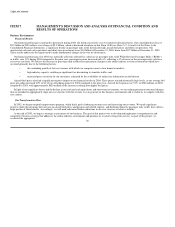
ITEM 6. SELECTED FINANCIAL DATA
Consolidated Summary of Operations
For the years ended December 31, 2004-2000
(in millions, except share data) 2004(1) 2003(2) 2002(3) 2001(4) 2000(5)
Operating revenues $ 15,002 $ 14,087 $ 13,866 $ 13,879 $ 16,741
Operating expenses 18,310 14,872 15,175 15,481 15,104
Operating income (loss) (3,308) (785) (1,309) (1,602) 1,637
Interest expense, net(6) (787) (721) (629) (410) (257)
Miscellaneous income, net(7) 125 326 17 80 328
Gain (loss) on extinguishment of debt, net 9 — (42) — —
Fair value adjustments of SFAS 133 derivatives (31) (9) (39) 68 (159)
Income (loss) before income taxes and cumulative effect of change in accounting principle (3,992) (1,189) (2,002) (1,864) 1,549
Income tax (provision) benefit (1,206) 416 730 648 (621)
Net income (loss) before cumulative effect of change in accounting principle (5,198) (773) (1,272) (1,216) 928
Net income (loss) after cumulative effect of change in accounting principle (5,198) (773) (1,272) (1,216) 828
Preferred stock dividends (19) (17) (15) (14) (13)
Net income (loss) attributable to common shareowners $ (5,217) $ (790) $ (1,287) $ (1,230) $ 815
Earnings (loss) per share before cumulative effect of change in accounting principle
Basic $ (41.07) $ (6.40) $ (10.44) $ (9.99) $ 7.39
Diluted $ (41.07) $ (6.40) $ (10.44) $ (9.99) $ 7.05
Earnings (loss) per share
Basic $ (41.07) $ (6.40) $ (10.44) $ (9.99) $ 6.58
Diluted $ (41.07) $ (6.40) $ (10.44) $ (9.99) $ 6.28
Dividends declared per common share $ — $ 0.05 $ 0.10 $ 0.10 $ 0.10
Other Financial and Statistical Data
For the years ended December 31, 2004-2000
2004(1) 2003(2) 2002(3) 2001(4) 2000(5)
Total assets (millions) $ 21,801 $ 25,939 $ 24,303 $ 23,605 $ 21,931
Long-term debt and capital leases (excluding current maturities) (millions) $ 13,005 $ 11,538 $ 10,174 $ 8,347 $ 5,896
Shareowners' (deficit) equity (millions) $ (5,796) $ (659) $ 893 $ 3,769 $ 5,343
Shares of common stock outstanding at year end 139,830,443 123,544,945 123,359,205 123,245,666 123,013,372
Revenue passengers enplaned (thousands) 110,000 104,452 107,048 104,943 119,930
Available seat miles (millions) 151,679 139,505 145,232 147,837 154,974
Revenue passenger miles (millions) 113,311 102,301 104,422 101,717 112,998
Operating revenue per available seat mile 9.89¢ 10.10¢ 9.55¢ 9.39¢ 10.80¢
Passenger mile yield 12.17¢ 12.73¢ 12.26¢ 12.74¢ 13.86¢
Operating cost per available seat mile 12.07¢ 10.66¢ 10.45¢ 10.47¢ 9.75¢
Passenger load factor 74.70% 73.33% 71.90% 68.80% 72.91%
Breakeven passenger load factor 92.62% 77.75% 79.25% 77.31% 65.29%
Fuel gallons consumed (millions) 2,527 2,370 2,514 2,649 2,922
Average price per fuel gallon, net of hedging gains 115.70¢ 81.78¢ 66.94¢ 68.60¢ 67.38¢
(1) Includes a $1.9 billion charge ($14.76 diluted EPS) related to the impairment of intangible assets; a $1.2 billion charge ($9.51 diluted EPS) for an income
tax provision to reserve substantially all of our net deferred tax assets; a $123 million gain ($0.97 diluted EPS) from the sale of investments; and a
$41 million gain ($0.33 diluted EPS) from restructuring, asset writedowns, pension settlements and related items, net (see "Management's Discussion and
Analysis" in Item 7).
(2) Includes a $268 million charge ($169 million net of tax, or $1.37 diluted EPS) for restructuring, asset writedowns, pension settlements and related items,
net; a $398 million gain ($251 million net of tax, or $2.03 diluted EPS) for24