Delta Airlines 2004 Annual Report Download - page 117
Download and view the complete annual report
Please find page 117 of the 2004 Delta Airlines annual report below. You can navigate through the pages in the report by either clicking on the pages listed below, or by using the keyword search tool below to find specific information within the annual report.-
 1
1 -
2
-
3
-
4
-
5
-
6
-
7
-
8
-
9
-
10
-
11
-
12
-
13
-
14
-
15
-
16
-
17
-
18
-
19
-
20
-
21
-
22
-
23
-
24
-
25
-
26
-
27
-
28
-
29
-
30
-
31
-
32
-
33
-
34
-
35
-
36
-
37
-
38
-
39
-
40
-
41
-
42
-
43
-
44
-
45
-
46
-
47
-
48
-
49
-
50
-
51
-
52
-
53
-
54
-
55
-
56
-
57
-
58
-
59
-
60
-
61
-
62
-
63
-
64
-
65
-
66
-
67
-
68
-
69
-
70
-
71
-
72
-
73
-
74
-
75
-
76
-
77
-
78
-
79
-
80
-
81
-
82
-
83
-
84
-
85
-
86
-
87
-
88
-
89
-
90
-
91
-
92
-
93
-
94
-
95
-
96
-
97
-
98
-
99
-
100
-
101
-
102
-
103
-
104
-
105
-
106
-
 107
107 -
 108
108 -
 109
109 -
 110
110 -
 111
111 -
 112
112 -
 113
113 -
 114
114 -
 115
115 -
 116
116 -
 117
117 -
 118
118 -
 119
119 -
 120
120 -
 121
121 -
 122
122 -
 123
123 -
 124
124 -
 125
125 -
 126
126 -
 127
127 -
128
-
129
-
130
-
131
-
132
-
133
-
134
-
135
-
136
-
137
 |
 |
.
.
.
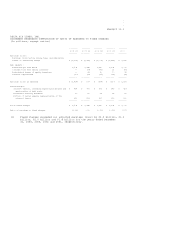
EXHIBIT 12.1
DELTA AIR LINES, INC.
STATEMENT REGARDING COMPUTATION OF RATIO OF EARNINGS TO FIXED CHARGES
(In millions, except ratios)
-------- -------- -------- -------- --------
2004 (1) 2003 (1) 2002 (1) 2001 (1) 2000
-------- -------- -------- -------- --------
Earnings (loss):
Earnings (loss) before income taxes and cumulative
effect of accounting change $ (3,992) $ (1,189) $ (2,002) $ (1,864) $ 1,549
Add (deduct):
Fixed charges from below 1,504 1,448 1,340 1,204 1,079
(Income)/loss from equity investees -- (14) (41) 12 (59)
Distributed income of equity investees -- 44 40 70 32
Interest capitalized (10) (12) (15) (32) (45)
-------- -------- -------- -------- --------
Earnings (loss) as adjusted $ (2,498) $ 277 $ (678) $ (610) $ 2,556
Fixed charges:
Interest expense, including capitalized amounts and $ 834 $ 769 $ 679 $ 543 $ 427
amortization of debt costs
Preference security dividend 19 25 24 22 22
Portion of rental expense representative of the
interest factor 651 654 637 639 630
-------- -------- -------- -------- --------
Total fixed charges $ 1,504 $ 1,448 $ 1,340 $ 1,204 $ 1,079
Ratio of earnings to fixed charges (1.66) 0.19 (0.51) (0.51) 2.37
(1) Fixed charges exceeded our adjusted earnings (loss) by $4.0 billion, $1.2
billion, $2.0 billion and $1.8 billion for the years ended December
31, 2004, 2003, 2002 and 2001, respectively.