Delta Airlines 2004 Annual Report Download - page 94
Download and view the complete annual report
Please find page 94 of the 2004 Delta Airlines annual report below. You can navigate through the pages in the report by either clicking on the pages listed below, or by using the keyword search tool below to find specific information within the annual report.-
 1
1 -
2
-
3
-
4
-
5
-
6
-
7
-
8
-
9
-
10
-
11
-
12
-
13
-
14
-
15
-
16
-
17
-
18
-
19
-
20
-
21
-
22
-
23
-
24
-
25
-
26
-
27
-
28
-
29
-
30
-
31
-
32
-
33
-
34
-
35
-
36
-
37
-
38
-
39
-
40
-
41
-
42
-
43
-
44
-
45
-
46
-
47
-
48
-
49
-
50
-
51
-
52
-
53
-
54
-
55
-
56
-
57
-
58
-
59
-
60
-
61
-
62
-
63
-
64
-
65
-
66
-
67
-
68
-
69
-
70
-
71
-
72
-
73
-
74
-
75
-
76
-
77
-
78
-
79
-
80
-
81
-
82
-
83
-
 84
84 -
 85
85 -
 86
86 -
 87
87 -
 88
88 -
 89
89 -
 90
90 -
 91
91 -
 92
92 -
 93
93 -
 94
94 -
 95
95 -
 96
96 -
 97
97 -
 98
98 -
 99
99 -
 100
100 -
 101
101 -
 102
102 -
 103
103 -
 104
104 -
105
-
106
-
107
-
108
-
109
-
110
-
111
-
112
-
113
-
114
-
115
-
116
-
117
-
118
-
119
-
120
-
121
-
122
-
123
-
124
-
125
-
126
-
127
-
128
-
129
-
130
-
131
-
132
-
133
-
134
-
135
-
136
-
137
 |
 |
Table of Contents
NOTES TO THE CONSOLIDATED FINANCIAL STATEMENTS — (Continued)
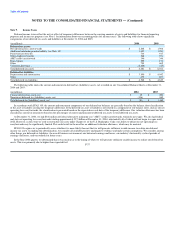
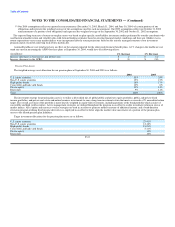
Note 9. Income Taxes
Deferred income taxes reflect the net tax effect of temporary differences between the carrying amounts of assets and liabilities for financial reporting
purposes and income tax purposes (see Note 1 for information about our accounting policy for income taxes). The following table shows significant
components of our deferred tax assets and liabilities at December 31, 2004 and 2003:
(in millions) 2004 2003
Deferred tax assets:
Net operating loss carryforwards $ 2,848 $ 1,908
Additional minimum pension liability (see Note 10) 1,427 1,454
Postretirement benefits 734 917
Other employee benefits 568 571
AMT credit carryforward 346 346
Rent expense 255 178
Other 703 662
Valuation allowance (2,400) (25)
Total deferred tax assets $ 4,481 $ 6,011
Deferred tax liabilities:
Depreciation and amortization $ 3,890 $ 4,042
Other 672 807
Total deferred tax liabilities $ 4,562 $ 4,849
The following table shows the current and noncurrent deferred tax (liabilities) assets, net recorded on our Consolidated Balance Sheets at December 31,
2004 and 2003:
(in millions) 2004 2003
Current deferred tax assets, net $ 35 $ 293
Noncurrent deferred tax (liabilities) assets, net (116) 869
Total deferred tax (liabilities) assets, net $ (81) $ 1,162
In accordance with SFAS 109, the current and noncurrent components of our deferred tax balances are generally based on the balance sheet classification
of the asset or liability creating the temporary difference. If the deferred tax asset or liability is not related to a component of our balance sheet, such as our net
operating loss carryforwards, the classification is presented based on the expected reversal date of the temporary difference. Our valuation allowance has been
classified as current or noncurrent based on the percentages of current and noncurrent deferred tax assets to total deferred tax assets.
At December 31, 2004, we had $346 million of federal alternative minimum tax ("AMT") credit carryforwards, which do not expire. We also had federal
and state net operating loss carryforwards totaling approximately $7.5 billion at December 31, 2004, substantially all of which will not begin to expire until
2022. However, in the event we seek to restructure our costs under Chapter 11 of the U.S. Bankruptcy Code, our ability to utilize our net operating loss
carryforwards may be significantly limited. This could result in the need for an additional valuation allowance, which may be material.
SFAS 109 requires us to periodically assess whether it is more likely than not that we will generate sufficient taxable income to realize our deferred
income tax assets. In making this determination, we consider all available positive and negative evidence and make certain assumptions. We consider, among
other things, our deferred tax liabilities; the overall business environment; our historical earnings and losses; our industry's historically cyclical periods of
earnings and losses; and our outlook for future years.
In the June 2004 quarter, we determined that it was unclear as to the timing of when we will generate sufficient taxable income to realize our deferred tax
assets. This was primarily due to higher than expected fuel F-37