DIRECTV 2011 Annual Report Download - page 99
Download and view the complete annual report
Please find page 99 of the 2011 DIRECTV annual report below. You can navigate through the pages in the report by either clicking on the pages listed below, or by using the keyword search tool below to find specific information within the annual report.-
 1
1 -
2
-
3
-
4
-
5
-
6
-
7
-
8
-
9
-
10
-
11
-
12
-
13
-
14
-
15
-
16
-
17
-
18
-
19
-
20
-
21
-
22
-
23
-
24
-
25
-
26
-
27
-
28
-
29
-
30
-
31
-
32
-
33
-
34
-
35
-
36
-
37
-
38
-
39
-
40
-
41
-
42
-
43
-
44
-
45
-
46
-
47
-
48
-
49
-
50
-
51
-
52
-
53
-
54
-
55
-
56
-
57
-
58
-
59
-
60
-
61
-
62
-
63
-
64
-
65
-
66
-
67
-
68
-
69
-
70
-
71
-
72
-
73
-
74
-
75
-
76
-
77
-
78
-
79
-
80
-
81
-
82
-
83
-
84
-
85
-
86
-
87
-
88
-
 89
89 -
 90
90 -
 91
91 -
 92
92 -
 93
93 -
 94
94 -
 95
95 -
 96
96 -
 97
97 -
 98
98 -
 99
99 -
 100
100 -
 101
101 -
 102
102 -
 103
103 -
 104
104 -
 105
105 -
 106
106 -
 107
107 -
 108
108 -
 109
109 -
110
-
111
-
112
-
113
-
114
-
115
-
116
-
117
-
118
-
119
-
120
-
121
-
122
-
123
-
124
-
125
-
126
-
127
-
128
-
129
-
130
-
131
-
132
-
133
-
134
-
135
-
136
-
137
-
138
-
139
-
140
-
141
-
142
-
143
-
144
-
145
-
146
-
147
-
148
-
149
-
150
-
151
-
152
 |
 |

DIRECTV
NOTES TO THE CONSOLIDATED FINANCIAL STATEMENTS—(continued)
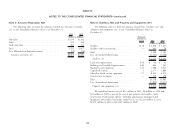
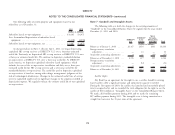
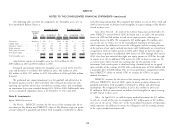
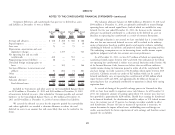
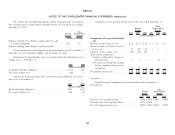
The following table sets forth the book value of our investments which we Marketable Equity Securities
account for under the equity method of accounting: The following table sets forth our cost basis, the current fair value and the
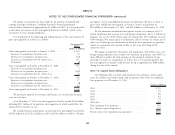
accumulated unrealized gains (losses), net of taxes, included as part of accumulated
As of December 31,
other comprehensive income of our marketable equity securities:
2011 2010
(Dollars in Millions) As of December 31,
Sky Mexico ................................. $ 490 $ 501 2011 2010
GSN ..................................... 420 446 Accumulated Accumulated
Fair Unrealized Fair Unrealized
Other equity method investments .................. 131 139 Cost Market Gain (Loss), Cost Market Gain,
Basis Value Net of Taxes Basis Value Net of Taxes
Total investments accounted for the equity method of
(Dollars in Millions)
accounting ................................ $1,041 $1,086 Marketable equity securities in a gain position . $ 5 $11 $ 4 $14 $29 $ 9
Marketable equity securities in a loss position . 8 6 (1) — — —
The following table sets forth equity in earnings and losses of our investments Total marketable equity securities ........ $13 $17 $3 $14 $29 $9
accounted for under the equity method of accounting for the periods presented:
Our marketable equity securities are classified as available-for-sale. We
Years Ended
December 31, calculated the fair values based on quoted market prices of our investments, which
2011 2010 2009 is a Level 1 input under accounting standards for fair value measurement.
(Dollars in Millions) We sold marketable equity securities in cash for $1 million in 2011 and
Sky Mexico ................................ $ 52 $33 $32 $9 million in 2010. As a result of these sales, we recognized a $1 million gain,
GSN .................................... 29 33 — $1 million after tax, in 2011 and a $6 million gain, $4 million after tax, in 2010
Other .................................... 28 24 19 in ‘‘Other, net’’ in the Consolidated Statements of Operations, which represents the
Total equity earnings for investments accounted for under difference between the selling price and the cost basis of the marketable equity
the equity method of accounting ................ $109 $90 $51 securities sold.
We received cash dividends of $104 million in 2011, $78 million in 2010 and Non-Marketable Equity Securities
$94 million in 2009 from companies that we account for under the equity method.
We had investments in non-marketable equity securities of $56 million as of
Undistributed earnings from equity method investments were $256 million as of
December 31, 2011 and $45 million as of December 31, 2010, which were stated
December 31, 2011 and $219 million as of December 31, 2010.
at cost.
We paid cash of $11 million in 2011 to acquire interests in companies we
account for under the cost method of accounting.
75