DIRECTV 2011 Annual Report Download - page 69
Download and view the complete annual report
Please find page 69 of the 2011 DIRECTV annual report below. You can navigate through the pages in the report by either clicking on the pages listed below, or by using the keyword search tool below to find specific information within the annual report.-
 1
1 -
2
-
3
-
4
-
5
-
6
-
7
-
8
-
9
-
10
-
11
-
12
-
13
-
14
-
15
-
16
-
17
-
18
-
19
-
20
-
21
-
22
-
23
-
24
-
25
-
26
-
27
-
28
-
29
-
30
-
31
-
32
-
33
-
34
-
35
-
36
-
37
-
38
-
39
-
40
-
41
-
42
-
43
-
44
-
45
-
46
-
47
-
48
-
49
-
50
-
51
-
52
-
53
-
54
-
55
-
56
-
57
-
58
-
 59
59 -
 60
60 -
 61
61 -
 62
62 -
 63
63 -
 64
64 -
 65
65 -
 66
66 -
 67
67 -
 68
68 -
 69
69 -
 70
70 -
 71
71 -
 72
72 -
 73
73 -
 74
74 -
 75
75 -
 76
76 -
 77
77 -
 78
78 -
 79
79 -
80
-
81
-
82
-
83
-
84
-
85
-
86
-
87
-
88
-
89
-
90
-
91
-
92
-
93
-
94
-
95
-
96
-
97
-
98
-
99
-
100
-
101
-
102
-
103
-
104
-
105
-
106
-
107
-
108
-
109
-
110
-
111
-
112
-
113
-
114
-
115
-
116
-
117
-
118
-
119
-
120
-
121
-
122
-
123
-
124
-
125
-
126
-
127
-
128
-
129
-
130
-
131
-
132
-
133
-
134
-
135
-
136
-
137
-
138
-
139
-
140
-
141
-
142
-
143
-
144
-
145
-
146
-
147
-
148
-
149
-
150
-
151
-
152
 |
 |

DIRECTV
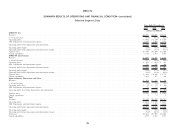
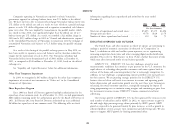
Earnings Per Share. Class A common stock earnings per share (DIRECTV DIRECTV U.S. Segment
Group common stock for the period January 1, 2009 through November 19, 2009) The following table provides operating results and a summary of key
and weighted shares outstanding were as follows for the years ended December 31: subscriber data for the DIRECTV U.S. segment:
2010 2009 Change
(Shares in 2010 2009 $ %
Millions) (Dollars in Millions, Except Per
Basic earnings attributable to DIRECTV Class A common Subscriber Amounts)
Revenues ............................ $20,268 $18,671 $1,597 8.6%
stockholders per common share ...................... $2.31 $0.96 Operating costs and expenses
Diluted earnings attributable to DIRECTV Class A common Costs of revenues, exclusive of depreciation and
stockholders per common share ...................... 2.30 0.95 amortization expense
Weighted average number of Class A common shares outstanding Broadcast programming and other .......... 8,699 8,027 672 8.4%
Subscriber service expenses . . . ............ 1,340 1,268 72 5.7%
Basic ......................................... 870 982 Broadcast operations expenses ............. 273 274 (1) (0.4)%
Diluted ....................................... 876 989 Selling, general and administrative expenses, exclusive
of depreciation and amortization expense
The increases in basic and diluted earnings per share for Class A common Subscriber acquisition costs . . . ............ 2,631 2,478 153 6.2%
stock were due to higher net income attributable to DIRECTV, the charge recorded Upgrade and retention costs .............. 1,106 1,045 61 5.8%
for the Liberty Transaction in 2009 and a reduction in weighted shares outstanding General and administrative expenses ......... 1,003 894 109 12.2%
Depreciation and amortization expense ........... $1,926 $ 2,275 $ (349) (15.3)%
resulting from our share repurchase program and the effect of the Liberty
Transaction, partially offset by the $160 million inducement in 2010 paid in Total operating costs and expenses ......... 16,978 16,261 717 4.4%
connection with the Malone Transaction. Operating profit ........................ $3,290 $ 2,410 $ 880 36.5%
Operating profit margin ................... 16.2% 12.9% — —
Other data:
Operating profit before depreciation and amortization . . $ 5,216 $ 4,685 $ 531 11.3%
Operating profit before depreciation and amortization
margin ............................ 25.7% 25.1% — —
Total number of subscribers (in thousands) ........ 19,223 18,560 663 3.6%
ARPU .............................. $89.71 $ 85.48 $ 4.23 4.9%
Average monthly subscriber churn % ............ 1.53% 1.53% — —%
Gross subscriber additions (in thousands) ......... 4,124 4,273 (149) (3.5)%
Subscriber disconnections (in thousands) .......... 3,461 3,334 127 3.8%
Net subscriber additions (in thousands) .......... 663 939 (276) (29.4)%
Average subscriber acquisition costs—per subscriber
(SAC)............................. $ 796 $ 712 $ 84 11.8%
Capitalized subscriber leased equipment:
Subscriber leased equipment—subscriber acquisitions . . $ 651 $ 564 $ 87 15.4%
Subscriber leased equipment—upgrade and retention . . 316 419 (103) (24.6)%
Total subscriber leased equipment capitalized ....... $ 967 $ 983 $ (16) (1.6)%
Depreciation expense—subscriber leased equipment . . . $ 1,145 $ 1,333 $ (188) (14.1)%
Subscribers. In 2010, gross subscriber additions decreased primarily due to the
impact of the transition to digital broadcast in 2009 and lower additions from our
45