DIRECTV 2011 Annual Report Download - page 129
Download and view the complete annual report
Please find page 129 of the 2011 DIRECTV annual report below. You can navigate through the pages in the report by either clicking on the pages listed below, or by using the keyword search tool below to find specific information within the annual report.-
 1
1 -
2
-
3
-
4
-
5
-
6
-
7
-
8
-
9
-
10
-
11
-
12
-
13
-
14
-
15
-
16
-
17
-
18
-
19
-
20
-
21
-
22
-
23
-
24
-
25
-
26
-
27
-
28
-
29
-
30
-
31
-
32
-
33
-
34
-
35
-
36
-
37
-
38
-
39
-
40
-
41
-
42
-
43
-
44
-
45
-
46
-
47
-
48
-
49
-
50
-
51
-
52
-
53
-
54
-
55
-
56
-
57
-
58
-
59
-
60
-
61
-
62
-
63
-
64
-
65
-
66
-
67
-
68
-
69
-
70
-
71
-
72
-
73
-
74
-
75
-
76
-
77
-
78
-
79
-
80
-
81
-
82
-
83
-
84
-
85
-
86
-
87
-
88
-
89
-
90
-
91
-
92
-
93
-
94
-
95
-
96
-
97
-
98
-
99
-
100
-
101
-
102
-
103
-
104
-
105
-
106
-
107
-
108
-
109
-
110
-
111
-
112
-
113
-
114
-
115
-
116
-
117
-
118
-
 119
119 -
 120
120 -
 121
121 -
 122
122 -
 123
123 -
 124
124 -
 125
125 -
 126
126 -
 127
127 -
 128
128 -
 129
129 -
 130
130 -
 131
131 -
 132
132 -
 133
133 -
 134
134 -
 135
135 -
 136
136 -
 137
137 -
 138
138 -
 139
139 -
140
-
141
-
142
-
143
-
144
-
145
-
146
-
147
-
148
-
149
-
150
-
151
-
152
 |
 |

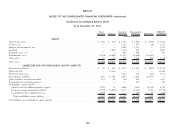
DIRECTV
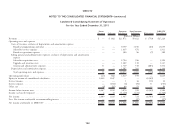
NOTES TO THE CONSOLIDATED FINANCIAL STATEMENTS—(continued)
Condensed Consolidating Balance Sheet
As of December 31, 2011
Parent Guarantor Non-Guarantor DIRECTV
Guarantor Co-Issuers Subsidiaries Subsidiaries Eliminations Consolidated
(Dollars in Millions)
ASSETS
Total current assets .................................................. $ 404 $ 533 $ 2,514 $ 1,360 $ (570) $ 4,241
Satellites, net ...................................................... — — 1,724 497 (6) 2,215
Property and equipment, net ............................................ — — 3,084 2,139 — 5,223
Goodwill ......................................................... — 1,828 1,349 920 — 4,097
Intangible assets, net ................................................. — — 461 448 — 909
Intercompany assets .................................................. (1,764) 16,068 11,427 (4,490) (21,241) —
Other assets ....................................................... 74 64 256 1,424 (80) 1,738
Total assets ........................................................ $(1,286) $18,493 $20,815 $ 2,298 $(21,897) $18,423
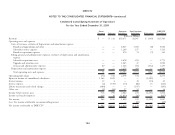
LIABILITIES AND STOCKHOLDERS’ EQUITY (DEFICIT)
Total current liabilities ................................................ $ 68 $ 204 $ 3,413 $ 1,347 $ (289) $ 4,743
Long-term debt ..................................................... — 13,464 — — — 13,464
Deferred income taxes ................................................ — — 1,321 531 (81) 1,771
Intercompany liabilities ................................................ 1,202 11,582 3,865 5,938 (22,587) —
Other liabilities and deferred credits ....................................... 551 82 159 495 — 1,287
Redeemable noncontrolling interest ........................................ — — — 265 — 265
Stockholders’ equity (deficit)
Capital stock and additional paid-in capital ................................. 4,799 11 4,684 (561) (4,134) 4,799
Retained earnings (accumulated deficit) ................................... (7,750) (6,850) 7,373 (5,703) 5,180 (7,750)
Accumulated other comprehensive loss .................................... (156) — — (14) 14 (156)
Total stockholders’ equity (deficit) ..................................... (3,107) (6,839) 12,057 (6,278) 1,060 (3,107)
Total liabilities and stockholders’ equity (deficit) ............................... $(1,286) $18,493 $20,815 $ 2,298 $(21,897) $18,423
105