DIRECTV 2011 Annual Report Download - page 82
Download and view the complete annual report
Please find page 82 of the 2011 DIRECTV annual report below. You can navigate through the pages in the report by either clicking on the pages listed below, or by using the keyword search tool below to find specific information within the annual report.-
 1
1 -
2
-
3
-
4
-
5
-
6
-
7
-
8
-
9
-
10
-
11
-
12
-
13
-
14
-
15
-
16
-
17
-
18
-
19
-
20
-
21
-
22
-
23
-
24
-
25
-
26
-
27
-
28
-
29
-
30
-
31
-
32
-
33
-
34
-
35
-
36
-
37
-
38
-
39
-
40
-
41
-
42
-
43
-
44
-
45
-
46
-
47
-
48
-
49
-
50
-
51
-
52
-
53
-
54
-
55
-
56
-
57
-
58
-
59
-
60
-
61
-
62
-
63
-
64
-
65
-
66
-
67
-
68
-
69
-
70
-
71
-
 72
72 -
 73
73 -
 74
74 -
 75
75 -
 76
76 -
 77
77 -
 78
78 -
 79
79 -
 80
80 -
 81
81 -
 82
82 -
 83
83 -
 84
84 -
 85
85 -
 86
86 -
 87
87 -
 88
88 -
 89
89 -
 90
90 -
 91
91 -
 92
92 -
93
-
94
-
95
-
96
-
97
-
98
-
99
-
100
-
101
-
102
-
103
-
104
-
105
-
106
-
107
-
108
-
109
-
110
-
111
-
112
-
113
-
114
-
115
-
116
-
117
-
118
-
119
-
120
-
121
-
122
-
123
-
124
-
125
-
126
-
127
-
128
-
129
-
130
-
131
-
132
-
133
-
134
-
135
-
136
-
137
-
138
-
139
-
140
-
141
-
142
-
143
-
144
-
145
-
146
-
147
-
148
-
149
-
150
-
151
-
152
 |
 |

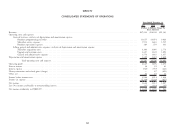
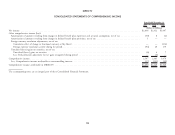
DIRECTV
CONSOLIDATED STATEMENTS OF OPERATIONS—(continued)
Years Ended December 31,
2011 2010 2009
(Dollars in Millions, Except Per
Share Amounts)
Net income attributable to common stockholders:
Net income attributable to DIRECTV Class A common stockholders (DIRECTV Group common stockholders for the period January 1, 2009
through November 19, 2009) ............................................................................ $ 2,609 $ 2,014 $ 942
Net income attributable to DIRECTV Class B common stockholders, for the period of November 19, 2009 through June 16, 2010, including
$160 million exchange inducement value for the Malone Transaction in 2010 ............................................. — 184 —
Net income attributable to DIRECTV ........................................................................ $ 2,609 $ 2,198 $ 942
Basic earnings attributable to DIRECTV Class A common stockholders per common share (DIRECTV Group common shares for the period
January 1, 2009 through November 19, 2009): ............................................................... $ 3.49 $ 2.31 $ 0.96
Diluted earnings attributable to DIRECTV Class A common stockholders per common share (DIRECTV Group common shares for the
period January 1, 2009 through November 19, 2009): .......................................................... $ 3.47 $ 2.30 $ 0.95
Basic and diluted earnings (loss) attributable to DIRECTV Class B common stockholders per common share, for the period of November 19,
2009 through June 16, 2010, including $160 million exchange inducement value for the Malone Transaction in 2010: .............. $ — $ 8.44 $ (0.02)
Weighted average number of Class A common shares outstanding (in millions)
Basic ............................................................................................ 747 870 982
Diluted .......................................................................................... 752 876 989
Weighted average number of Class B common shares outstanding, for the period of November 19, 2009 through June 16, 2010 (in millions)
Basic ............................................................................................ — 22 22
Diluted .......................................................................................... — 22 22
Weighted average number of total common shares outstanding (in millions):
Basic ............................................................................................ 747 880 985
Diluted .......................................................................................... 752 886 992
The accompanying notes are an integral part of these Consolidated Financial Statements.
58