DIRECTV 2011 Annual Report Download - page 132
Download and view the complete annual report
Please find page 132 of the 2011 DIRECTV annual report below. You can navigate through the pages in the report by either clicking on the pages listed below, or by using the keyword search tool below to find specific information within the annual report.-
 1
1 -
2
-
3
-
4
-
5
-
6
-
7
-
8
-
9
-
10
-
11
-
12
-
13
-
14
-
15
-
16
-
17
-
18
-
19
-
20
-
21
-
22
-
23
-
24
-
25
-
26
-
27
-
28
-
29
-
30
-
31
-
32
-
33
-
34
-
35
-
36
-
37
-
38
-
39
-
40
-
41
-
42
-
43
-
44
-
45
-
46
-
47
-
48
-
49
-
50
-
51
-
52
-
53
-
54
-
55
-
56
-
57
-
58
-
59
-
60
-
61
-
62
-
63
-
64
-
65
-
66
-
67
-
68
-
69
-
70
-
71
-
72
-
73
-
74
-
75
-
76
-
77
-
78
-
79
-
80
-
81
-
82
-
83
-
84
-
85
-
86
-
87
-
88
-
89
-
90
-
91
-
92
-
93
-
94
-
95
-
96
-
97
-
98
-
99
-
100
-
101
-
102
-
103
-
104
-
105
-
106
-
107
-
108
-
109
-
110
-
111
-
112
-
113
-
114
-
115
-
116
-
117
-
118
-
119
-
120
-
121
-
 122
122 -
 123
123 -
 124
124 -
 125
125 -
 126
126 -
 127
127 -
 128
128 -
 129
129 -
 130
130 -
 131
131 -
 132
132 -
 133
133 -
 134
134 -
 135
135 -
 136
136 -
 137
137 -
 138
138 -
 139
139 -
 140
140 -
 141
141 -
 142
142 -
143
-
144
-
145
-
146
-
147
-
148
-
149
-
150
-
151
-
152
 |
 |

DIRECTV
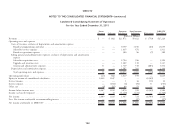
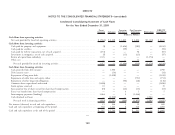
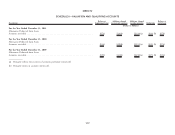
NOTES TO THE CONSOLIDATED FINANCIAL STATEMENTS—(continued)
Condensed Consolidating Statement of Cash Flows
For the Year Ended December 31, 2010
Parent Guarantor Non-Guarantor DIRECTV
Guarantor Co-Issuers Subsidiaries Subsidiaries Eliminations Consolidated
(Dollars in Millions)
Cash flows from operating activities
Net cash provided by (used in) operating activities ............................ $3,952 $ 2,263 $ 1,678 $ (607) $(2,080) $ 5,206
Cash flows from investing activities
Cash paid for property and equipment .................................... — — (1,444) (859) — (2,303)
Cash paid for satellites .............................................. — — (113) — — (113)
Investment in companies, net of cash acquired ............................... — — (1) (616) — (617)
Proceeds from sale of investments ....................................... — — — 9 — 9
Return of capital from subsidiary ....................................... 4,820 — — — (4,820) —
Other, net ...................................................... — — 3 (78) — (75)
Net cash provided by (used in) investing activities ........................... 4,820 — (1,555) (1,544) (4,820) (3,099)
Cash flows from financing activities
Cash proceeds from debt issuance ....................................... — 5,978 — — — 5,978
Debt issuance costs ................................................. — (44) — — — (44)
Repayment of long-term debt .......................................... — (2,323) — — — (2,323)
Proceeds from short-term borrowings ..................................... — — — 38 — 38
Repayment of collar loan and equity collars ................................ — — — (1,537) — (1,537)
Repayment of other long-term obligations .................................. — — (99) (28) — (127)
Common shares repurchased and retired ................................... (5,111) — — — — (5,111)
Stock options exercised .............................................. 38 — — — — 38
Taxes paid in lieu of shares issued for share-based compensation ................... (58) — (38) (22) — (118)
Excess tax benefit from share-based compensation ............................ — — 9 2 — 11
Dividends paid to redeemable noncontrolling interest .......................... — — — (15) — (15)
Intercompany payments (funding) ....................................... (3,751) — 2 3,749 — —
Cash dividend to Parent ............................................. — (6,900) — — 6,900 —
Net cash provided by (used in) financing activities .......................... (8,882) (3,289) (126) 2,187 6,900 (3,210)
Net increase (decrease) in cash and cash equivalents ............................. (110) (1,026) (3) 36 — (1,103)
Cash and cash equivalents at beginning of the period ............................ 557 1,709 7 332 — 2,605
Cash and cash equivalents at the end of the period ............................. $ 447 $ 683 $ 4 $ 368 $ — $1,502
108