DIRECTV 2011 Annual Report Download - page 149
Download and view the complete annual report
Please find page 149 of the 2011 DIRECTV annual report below. You can navigate through the pages in the report by either clicking on the pages listed below, or by using the keyword search tool below to find specific information within the annual report.-
 1
1 -
2
-
3
-
4
-
5
-
6
-
7
-
8
-
9
-
10
-
11
-
12
-
13
-
14
-
15
-
16
-
17
-
18
-
19
-
20
-
21
-
22
-
23
-
24
-
25
-
26
-
27
-
28
-
29
-
30
-
31
-
32
-
33
-
34
-
35
-
36
-
37
-
38
-
39
-
40
-
41
-
42
-
43
-
44
-
45
-
46
-
47
-
48
-
49
-
50
-
51
-
52
-
53
-
54
-
55
-
56
-
57
-
58
-
59
-
60
-
61
-
62
-
63
-
64
-
65
-
66
-
67
-
68
-
69
-
70
-
71
-
72
-
73
-
74
-
75
-
76
-
77
-
78
-
79
-
80
-
81
-
82
-
83
-
84
-
85
-
86
-
87
-
88
-
89
-
90
-
91
-
92
-
93
-
94
-
95
-
96
-
97
-
98
-
99
-
100
-
101
-
102
-
103
-
104
-
105
-
106
-
107
-
108
-
109
-
110
-
111
-
112
-
113
-
114
-
115
-
116
-
117
-
118
-
119
-
120
-
121
-
122
-
123
-
124
-
125
-
126
-
127
-
128
-
129
-
130
-
131
-
132
-
133
-
134
-
135
-
136
-
137
-
138
-
 139
139 -
 140
140 -
 141
141 -
 142
142 -
 143
143 -
 144
144 -
 145
145 -
 146
146 -
 147
147 -
 148
148 -
 149
149 -
 150
150 -
 151
151 -
 152
152
 |
 |
27FEB201222584136
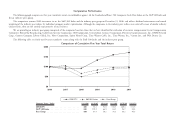
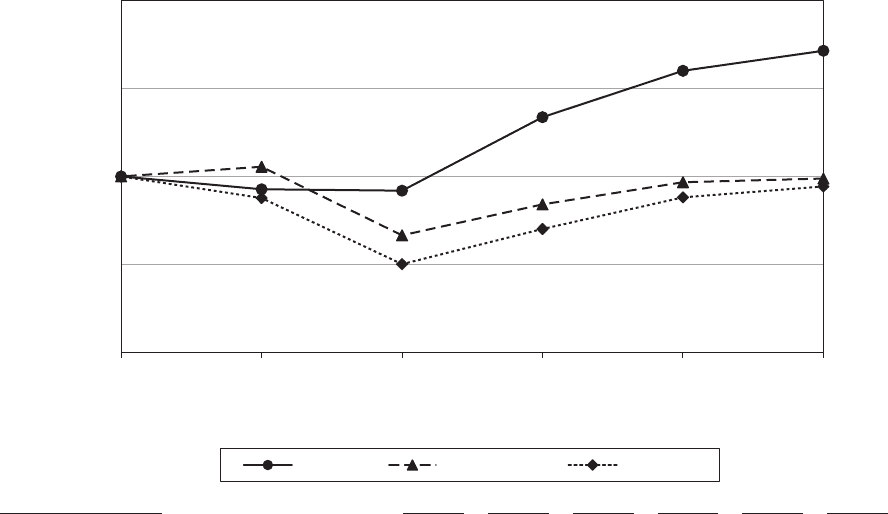
Comparative Performance
The following graph compares our five-year cumulative return to stockholders against: (a) the Standard and Poor’s 500 Composite Stock Price Index, or the S&P 500 Index and
(b) an industry peer group.
The comparison assumes $100 investment in us, the S&P 500 Index and the industry peer group on December 31, 2006, and reflects dividend reinvestment and annual
weighting of the industry peer indices by individual company market capitalization. Although the companies in the industry peer indices were selected because of similar industry
characteristics, they are not entirely representative of our business.
We are providing an industry peer group comprised of the companies based on those that we have identified for evaluation of executive compensation by our Compensation
Committee: British Sky Broadcasting, Cablevision Systems Corporation, CBS Corporation, CenturyLink, Comcast Corporation, Discovery Communications, Inc., DISH Network
Corp., Gannett Company, Liberty Global, Inc, News Corporation, Sprint Nextel Corp., Time Warner Cable, Inc., Time Warner, Inc., Viacom Inc., and Walt Disney Co.
The following table sets forth our five-year cumulative return along with the S&P 500 Index and the industry peer group.
Comparison of Cumulative Five Year Total Return
$0
$50
$100
$150
$200
2006 2007 2008 2009 2010 2011
DIRECTV S&P 500 Ind ex Peer Group
Company Name / Index 12/31/06 12/31/07 12/31/08 12/31/09 12/31/10 12/31/11
DIRECTV .......................... 100 92.7 91.9 133.7 160.1 171.5
S&P 500 Index ....................... 100 105.5 66.5 84.1 96.7 98.8
Peer Group ......................... 100 87.7 50.1 70.1 88.1 94.3