DIRECTV 2011 Annual Report Download - page 68
Download and view the complete annual report
Please find page 68 of the 2011 DIRECTV annual report below. You can navigate through the pages in the report by either clicking on the pages listed below, or by using the keyword search tool below to find specific information within the annual report.-
 1
1 -
2
-
3
-
4
-
5
-
6
-
7
-
8
-
9
-
10
-
11
-
12
-
13
-
14
-
15
-
16
-
17
-
18
-
19
-
20
-
21
-
22
-
23
-
24
-
25
-
26
-
27
-
28
-
29
-
30
-
31
-
32
-
33
-
34
-
35
-
36
-
37
-
38
-
39
-
40
-
41
-
42
-
43
-
44
-
45
-
46
-
47
-
48
-
49
-
50
-
51
-
52
-
53
-
54
-
55
-
56
-
57
-
 58
58 -
 59
59 -
 60
60 -
 61
61 -
 62
62 -
 63
63 -
 64
64 -
 65
65 -
 66
66 -
 67
67 -
 68
68 -
 69
69 -
 70
70 -
 71
71 -
 72
72 -
 73
73 -
 74
74 -
 75
75 -
 76
76 -
 77
77 -
 78
78 -
79
-
80
-
81
-
82
-
83
-
84
-
85
-
86
-
87
-
88
-
89
-
90
-
91
-
92
-
93
-
94
-
95
-
96
-
97
-
98
-
99
-
100
-
101
-
102
-
103
-
104
-
105
-
106
-
107
-
108
-
109
-
110
-
111
-
112
-
113
-
114
-
115
-
116
-
117
-
118
-
119
-
120
-
121
-
122
-
123
-
124
-
125
-
126
-
127
-
128
-
129
-
130
-
131
-
132
-
133
-
134
-
135
-
136
-
137
-
138
-
139
-
140
-
141
-
142
-
143
-
144
-
145
-
146
-
147
-
148
-
149
-
150
-
151
-
152
 |
 |

DIRECTV
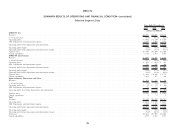
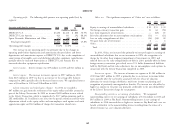
Operating profit. The following table presents our operating profit (loss) by Other, net. The significant components of ‘‘Other, net’’ were as follows:
segment: 2010 2009 Change
Change (Dollars in Millions)
Operating profit (loss) by segment: 2010 2009 $ % Equity in earnings of unconsolidated subsidiaries ....... $90 $51 $39
(Dollars in Millions) Net foreign currency transaction gain ............... 11 62 (51)
DIRECTV U.S. .................... $3,290 $2,410 $ 880 36.5% Loss from impairment of investments ............... — (45) 45
DIRECTV Latin America .............. 623 331 292 88.2% Fair-value adjustment loss on non-employee stock options . (11) — (11)
Sports Networks, Eliminations and Other .... (17) (68) 51 NM Loss on early extinguishment of debt ............... (16) (34) 18
Net gain from sale of investments ................. 6 — 6
Total operating profit ............... $3,896 $2,673 $1,223 45.8% Other .................................... (11) — (11)
Operating profit margin ............... 16.2% 12.4% — — Total ................................... $69 $34 $35
The increase in our operating profit was primarily due to the changes in
operating profit before depreciation and amortization discussed above and lower In 2010, Other, net increased due primarily to increased equity in earnings of
depreciation and amortization expense at DIRECTV U.S. due to the completion of unconsolidated subsidiaries due to our investment in GSN, the recognition of a
amortization of intangible assets and declining subscriber equipment capitalization, charge for the other than temporary impairment of investments in 2009, and
partially offset by increased depreciation at DIRECTV Latin America due to reduced losses on the early extinguishment of debt in 2010, partially offset by lower
increased subscriber equipment capitalization. foreign currency transaction gain related to net U.S. dollar denominated liabilities
held by Sky Brazil and fair-value adjustment loss on non-employee stock options in
Interest income. Interest income was $39 million in 2010 and $41 million in connection with the Liberty Transaction completed in 2009.
2009.
Income tax expense. The increase of income tax expense to $1,202 million in
Interest expense. The increase in interest expense to $557 million in 2010 2010 from $827 million in 2009 is primarily due to an increase in income before
from $423 million in 2009 was due to an increase in the average debt balances taxes, partially offset by tax benefits associated with the release of valuation
compared to 2009, partially offset by decreased interest rates. We capitalized interest allowances in certain foreign subsidiaries, multi-state income tax planning and
costs of $6 million in 2010 and $18 million in 2009. recognition of previously unrecognized tax benefits. The increase was also offset by
higher tax expense in the prior year primarily attributable to the non deductibility
Liberty transaction and related gains (charges). In 2010, we recorded a of the Liberty Transaction charge for tax purposes.
$67 million net gain from the settlement of the equity collars and debt assumed as
part of the Liberty Transaction. In 2009 we incurred $491 million in costs related Noncontrolling interests in net earnings of subsidiaries. We recognized
to the Liberty Transaction, which is comprised of a $337 million premium paid to noncontrolling interest in net earnings of subsidiaries of $114 million in 2010 and
LEI stockholders, $111 million in net losses for the partial settlement and fair-value $65 million in 2009 at Sky Brazil. Noncontrolling interest in net earnings of
adjustments related to the equity collars and non-employee stock options and stock subsidiaries in 2010 increased due to higher net income at Sky Brazil and a net tax
appreciation rights and $43 million of charges for transaction related costs. benefit attributable to the noncontrolling interest resulting from the release of a
deferred income tax asset valuation allowance.
44