DIRECTV 2011 Annual Report Download - page 66
Download and view the complete annual report
Please find page 66 of the 2011 DIRECTV annual report below. You can navigate through the pages in the report by either clicking on the pages listed below, or by using the keyword search tool below to find specific information within the annual report.-
 1
1 -
2
-
3
-
4
-
5
-
6
-
7
-
8
-
9
-
10
-
11
-
12
-
13
-
14
-
15
-
16
-
17
-
18
-
19
-
20
-
21
-
22
-
23
-
24
-
25
-
26
-
27
-
28
-
29
-
30
-
31
-
32
-
33
-
34
-
35
-
36
-
37
-
38
-
39
-
40
-
41
-
42
-
43
-
44
-
45
-
46
-
47
-
48
-
49
-
50
-
51
-
52
-
53
-
54
-
55
-
 56
56 -
 57
57 -
 58
58 -
 59
59 -
 60
60 -
 61
61 -
 62
62 -
 63
63 -
 64
64 -
 65
65 -
 66
66 -
 67
67 -
 68
68 -
 69
69 -
 70
70 -
 71
71 -
 72
72 -
 73
73 -
 74
74 -
 75
75 -
 76
76 -
77
-
78
-
79
-
80
-
81
-
82
-
83
-
84
-
85
-
86
-
87
-
88
-
89
-
90
-
91
-
92
-
93
-
94
-
95
-
96
-
97
-
98
-
99
-
100
-
101
-
102
-
103
-
104
-
105
-
106
-
107
-
108
-
109
-
110
-
111
-
112
-
113
-
114
-
115
-
116
-
117
-
118
-
119
-
120
-
121
-
122
-
123
-
124
-
125
-
126
-
127
-
128
-
129
-
130
-
131
-
132
-
133
-
134
-
135
-
136
-
137
-
138
-
139
-
140
-
141
-
142
-
143
-
144
-
145
-
146
-
147
-
148
-
149
-
150
-
151
-
152
 |
 |

DIRECTV
by an increase in the monthly churn rate, which resulted primarily from a more from three to four years, lower depreciation expense associated with a reduction in
competitive environment. capitalized set-top receivers over the last several years and the completion of the
amortization of a subscriber-related intangible asset, partially offset by lower
Revenues. Our revenues increased as a result of higher ARPU and the larger operating profit before depreciation and amortization margin.
subscriber base. The increase in ARPU resulted primarily from price increases on
programming packages, higher set-top receiver lease fees, higher advanced service DIRECTV Latin America Segment
fees, higher premium channel buy rates and an increase in NFL SUNDAY
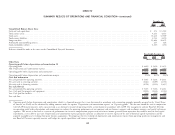
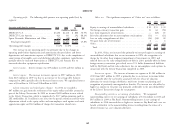
The following table provides operating results and a summary of key
TICKET revenues, partially offset by higher promotional offers to new and existing
subscriber data for the DIRECTV Latin America segment:
subscribers.
Change
Operating profit before depreciation and amortization. Operating profit before
2011 2010 $ %
depreciation and amortization was higher in 2011 as compared to 2010 as increased
(Dollars in Millions, Except Per
revenues were partially offset by higher broadcasting programming costs, increased Subscriber Amounts)
subscriber acquisition costs and higher upgrade and retention costs. Operating Revenues ......................... $5,096 $3,597 $1,499 41.7%
profit before depreciation and amortization margin decreased in 2011 as compared Operating profit before depreciation and
to 2010 as the revenue growth was more than offset by higher relative growth in amortization ..................... 1,663 1,164 499 42.9%
broadcast programming and other costs. Operating profit before depreciation and
Broadcast programming and other costs increased primarily due to annual amortization margin ................ 32.6% 32.4% — —
program supplier rate increases, higher costs resulting from our new NFL SUNDAY Operating profit .................... 916 623 293 47.0%
TICKET contract, which went into effect with the 2011 season and the larger Operating profit margin ............... 18.0% 17.3% — —
number of subscribers. Subscriber service expenses increased in 2011 compared to Other data:
2010 primarily due to service quality improvement initiatives and the higher ARPU ........................... $62.64 $57.95 $ 4.69 8.1%
number of subscribers. Average monthly total subscriber churn % . . . 1.78% 1.77% — 0.6%
Average monthly post paid subscriber churn % 1.42% 1.47% — (3.4)%
Subscriber acquisition costs and SAC per subscriber, which includes the cost of Total number of subscribers (in thousands) (1) 7,871 5,808 2,063 35.5%
capitalized set-top receivers, increased primarily due to higher subscriber demand for Gross subscriber additions (in thousands) .... 3,510 2,318 1,192 51.4%
advanced products, as well as higher gross additions and increased dealer Net subscriber additions (in thousands) ..... 2,063 1,220 843 69.1%
commissions, partially offset by lower marketing costs.
Upgrade and retention costs increased in 2011 due to a higher installation (1) DIRECTV Latin America subscriber data exclude subscribers of the Sky
costs associated with higher advanced equipment upgrades. Mexico platform.
General and administrative expenses increased in 2011 primarily due to Subscribers. The increase in gross subscriber additions was primarily due to
increased labor and benefit costs related to higher incentive compensation and higher demand for our middle market products, primarily in Brazil, as well as
increased headcount, as well as higher bad debt expense associated with higher increased gross subscriber additions in Argentina. Net subscriber additions increased
revenue, partially offset by a decrease in property tax expenses. in 2011 due to the higher gross subscriber additions and lower post paid churn in
Venezuela and Brazil compared to 2010.
Operating profit. Operating profit and operating profit margin increased in
2011 as compared to 2010 due to lower depreciation and amortization expense in Revenues. Revenues increased due to strong subscriber and ARPU growth
2011 resulting from the change in HD set-top receiver estimated depreciable life across the region, particularly in Brazil. ARPU increased primarily due to price
42