DIRECTV 2011 Annual Report Download - page 71
Download and view the complete annual report
Please find page 71 of the 2011 DIRECTV annual report below. You can navigate through the pages in the report by either clicking on the pages listed below, or by using the keyword search tool below to find specific information within the annual report.-
 1
1 -
2
-
3
-
4
-
5
-
6
-
7
-
8
-
9
-
10
-
11
-
12
-
13
-
14
-
15
-
16
-
17
-
18
-
19
-
20
-
21
-
22
-
23
-
24
-
25
-
26
-
27
-
28
-
29
-
30
-
31
-
32
-
33
-
34
-
35
-
36
-
37
-
38
-
39
-
40
-
41
-
42
-
43
-
44
-
45
-
46
-
47
-
48
-
49
-
50
-
51
-
52
-
53
-
54
-
55
-
56
-
57
-
58
-
59
-
60
-
 61
61 -
 62
62 -
 63
63 -
 64
64 -
 65
65 -
 66
66 -
 67
67 -
 68
68 -
 69
69 -
 70
70 -
 71
71 -
 72
72 -
 73
73 -
 74
74 -
 75
75 -
 76
76 -
 77
77 -
 78
78 -
 79
79 -
 80
80 -
 81
81 -
82
-
83
-
84
-
85
-
86
-
87
-
88
-
89
-
90
-
91
-
92
-
93
-
94
-
95
-
96
-
97
-
98
-
99
-
100
-
101
-
102
-
103
-
104
-
105
-
106
-
107
-
108
-
109
-
110
-
111
-
112
-
113
-
114
-
115
-
116
-
117
-
118
-
119
-
120
-
121
-
122
-
123
-
124
-
125
-
126
-
127
-
128
-
129
-
130
-
131
-
132
-
133
-
134
-
135
-
136
-
137
-
138
-
139
-
140
-
141
-
142
-
143
-
144
-
145
-
146
-
147
-
148
-
149
-
150
-
151
-
152
 |
 |

DIRECTV
partially offset by the effect of the devaluation in Venezuela and the increased December 31, 2011 from a deficit of $197 million at December 31, 2010. The
penetration of the middle-market segment. decrease during the year was mostly due to the decrease in our cash and cash
equivalents resulting from our share repurchase program and an increase in cash
The higher operating profit before depreciation and amortization was primarily paid for property, equipment and satellites, as well as an increase in accounts
from the increased gross profit generated from the higher revenues, coupled with payable, primarily due to amounts payable to our programmers. These decreases in
lower general and administrative expenses primarily due to a decrease of working capital were partially offset by an increase in accounts receivable and an
$191 million in the charges related to the exchange of Venezuelan currency. This increase in prepaid expenses.
was partially offset by an increase in subscriber acquisition costs due to a higher
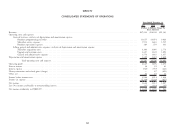
number of gross subscriber additions. Summary Cash Flow Information
The increase in operating profit was primarily due to higher operating profit Years Ended December 31,
before depreciation and amortization, partially offset by higher depreciation and 2011 2010 2009
amortization expense resulting from an increase in basic and advanced product (Dollars in Millions)
receivers capitalized related to the higher gross subscriber additions attained over the Net cash provided by operating activities ....... $5,185 $ 5,206 $ 4,431
last year. Net cash used in investing activities ........... (3,022) (3,099) (2,194)
Net cash used in financing activities ........... (2,792) (3,210) (1,637)
Sports Networks, Eliminations and Other Free cash flow:
Operating loss from Sports Networks, Elimination and Other decreased to Net cash provided by operating activities ....... $5,185 $ 5,206 $ 4,431
$17 million in 2010 from $68 million in 2009. Sports Networks, Eliminations and Less: Cash paid for property, equipment and
Other primarily consisted of corporate operating costs until November 19, 2009 satellites ........................... (3,170) (2,416) (2,071)
when we completed the Liberty Transaction and acquired the RSNs. Free cash flow ......................... $2,015 $ 2,790 $ 2,360
LIQUIDITY AND CAPITAL RESOURCES
Cash Flows Provided By Operating Activities
Our principal sources of liquidity are our cash, cash equivalents and the cash
Net cash provided by operating activities in 2011 and 2010 were relatively flat
flow that we generate from our operations. We expect that net cash provided by
as higher operating profit before depreciation and amortization was more than
operating activities will grow and believe that our existing cash balances and cash
offset by increased cash paid for interest and taxes and the decrease in working
provided by operations will be sufficient to fund our existing business plan.
capital discussed above. The increases in net cash provided by operating activities in
Additionally, in February 2011, DIRECTV U.S. entered into a new $2 billion
2010 and 2009 were primarily due to our higher operating profit before
revolving credit facility, which is available until 2016. In January 2012, we
depreciation and amortization, which resulted from the higher gross profit generated
borrowed $400 million under the revolving credit facility. We may borrow
from an increase in revenues. Cash paid for income taxes was $1,042 million in
additional funds under this facility to fund share repurchases or to fund strategic
2011, $705 million in 2010 and $484 million in 2009. The increase in cash paid
investment opportunities should they arise.
for income taxes in 2011 resulted mainly from increased income before income
At December 31, 2011, our cash and cash equivalents totaled $873 million taxes as well as the utilization of tax credit carryforwards in 2010. The increase in
compared with $1.5 billion at December 31, 2010. cash paid for income taxes in 2010 resulted mainly from increased income from
income before income taxes and prior year tax credits taken in 2009. Cash paid for
As a measure of liquidity, the current ratio (ratio of current assets to current
interest was $687 million in 2011, $460 million in 2010 and $412 million in
liabilities) was 0.89 at December 31, 2011 and 0.96 at December 31, 2010.
Working capital decreased by $305 million to a $502 million deficit at
47