DIRECTV 2011 Annual Report Download - page 57
Download and view the complete annual report
Please find page 57 of the 2011 DIRECTV annual report below. You can navigate through the pages in the report by either clicking on the pages listed below, or by using the keyword search tool below to find specific information within the annual report.-
 1
1 -
2
-
3
-
4
-
5
-
6
-
7
-
8
-
9
-
10
-
11
-
12
-
13
-
14
-
15
-
16
-
17
-
18
-
19
-
20
-
21
-
22
-
23
-
24
-
25
-
26
-
27
-
28
-
29
-
30
-
31
-
32
-
33
-
34
-
35
-
36
-
37
-
38
-
39
-
40
-
41
-
42
-
43
-
44
-
45
-
46
-
 47
47 -
 48
48 -
 49
49 -
 50
50 -
 51
51 -
 52
52 -
 53
53 -
 54
54 -
 55
55 -
 56
56 -
 57
57 -
 58
58 -
 59
59 -
 60
60 -
 61
61 -
 62
62 -
 63
63 -
 64
64 -
 65
65 -
 66
66 -
 67
67 -
68
-
69
-
70
-
71
-
72
-
73
-
74
-
75
-
76
-
77
-
78
-
79
-
80
-
81
-
82
-
83
-
84
-
85
-
86
-
87
-
88
-
89
-
90
-
91
-
92
-
93
-
94
-
95
-
96
-
97
-
98
-
99
-
100
-
101
-
102
-
103
-
104
-
105
-
106
-
107
-
108
-
109
-
110
-
111
-
112
-
113
-
114
-
115
-
116
-
117
-
118
-
119
-
120
-
121
-
122
-
123
-
124
-
125
-
126
-
127
-
128
-
129
-
130
-
131
-
132
-
133
-
134
-
135
-
136
-
137
-
138
-
139
-
140
-
141
-
142
-
143
-
144
-
145
-
146
-
147
-
148
-
149
-
150
-
151
-
152
 |
 |

DIRECTV
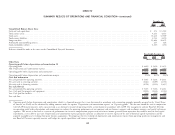
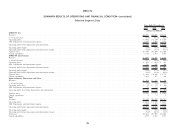
SUMMARY RESULTS OF OPERATIONS AND FINANCIAL CONDITION—(continued)
December 31,
2011 2010
(Dollars in Millions)
Consolidated Balance Sheets Data:
Cash and cash equivalents .......................................................................................... $ 873 $1,502
Total current assets ............................................................................................... 4,241 4,253
Total assets .................................................................................................... 18,423 17,909
Total current liabilities ............................................................................................. 4,743 4,450
Long-term debt ................................................................................................. 13,464 10,472
Redeemable noncontrolling interest ..................................................................................... 265 224
Total stockholders’ deficit ........................................................................................... (3,107) (194)
Reference should be made to the notes to the Consolidated Financial Statements.
Years Ended December 31,
2011 2010 2009
(Dollars in Millions)
Other Data:
Operating profit before depreciation and amortization (1)
Operating profit .......................................................................................... $4,629 $ 3,896 $ 2,673
Add: Depreciation and amortization expense ......................................................................... 2,349 2,482 2,640
Operating profit before depreciation and amortization ................................................................... $6,978 $ 6,378 $ 5,313
Operating profit before depreciation and amortization margin .............................................................. 25.6% 26.5% 24.6%
Cash flow information
Net cash provided by operating activities ........................................................................... $5,185 $ 5,206 $ 4,431
Net cash used in investing activities .............................................................................. (3,022) (3,099) (2,194)
Net cash used in financing activities .............................................................................. (2,792) (3,210) (1,637)
Free cash flow (2)
Net cash provided by operating activities ........................................................................... $5,185 $ 5,206 $ 4,431
Less: Cash paid for property and equipment ......................................................................... (2,924) (2,303) (2,012)
Less: Cash paid for satellites ................................................................................... (246) (113) (59)
Free cash flow ........................................................................................... $2,015 $ 2,790 $ 2,360
(1) Operating profit before depreciation and amortization, which is a financial measure that is not determined in accordance with accounting principles generally accepted in the United States
of America, or GAAP, can be calculated by adding amounts under the caption ‘‘Depreciation and amortization expense’’ to ‘‘Operating profit.’’ This measure should be used in conjunction
with GAAP financial measures and is not presented as an alternative measure of operating results, as determined in accordance with GAAP. Our management and our Board of Directors
use operating profit before depreciation and amortization to evaluate the operating performance of our company and our business segments and to allocate resources and capital to business
segments. This metric is also used as a measure of performance for incentive compensation purposes and to measure income generated from operations that could be used to fund capital
expenditures, service debt or pay taxes. Depreciation and amortization expense primarily represents an allocation to current expense of the cost of historical capital expenditures and for
acquired intangible assets resulting from prior business acquisitions. To compensate for the exclusion of depreciation and amortization expense from operating profit, our management and
our Board of Directors separately measure and budget for capital expenditures and business acquisitions.
33